

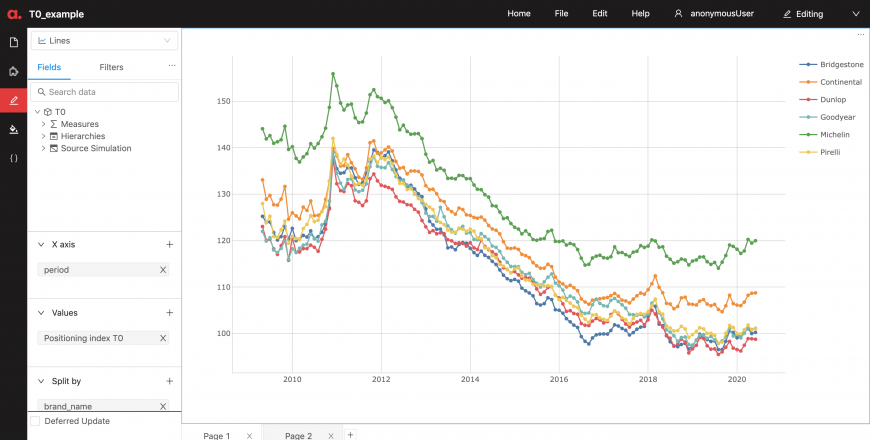
Being able to elaborate a dynamic Market Price Index, to monitor over time your price levels compared to competitors, is key to proactively adjusting your pricing strategy.
Lizeo and ActiveViam leveraged their complementary expertise in order to build a Market Price Index for the tyre industry with Atoti.
What is a Market Price Index?
A price index is a weighted average of price ratios, for a given category of goods or services in a determined area, during a specific time range.
Applied to a database of competitors’ prices, the Price Index becomes a Market Price Index, and allows to analyse the competitiveness of your prices at various levels of granularity, ranging from an entire market segment to the lowest level of an SKU.
Numerous calculation methods can be used to aggregate the Market Price Index, but they consistently include a weighting scheme taking into account sales volumes and products similarity.
Aggregating the Market Price Index: a Business Need which Makes Business Intelligence Tools Reach their Limits
In this case study, (Market Price Index built by a Global Top 5 tyres manufacturer), the competitors prices database Lizeo Price includes prices which were collected daily on the main tyres retailing websites worldwide (800 websites), for every product reference on those websites since 2009 (which means approximately 11 million prices are collected every day). It represents a data history of several billions of prices.
Based on this data, a daily Big Data pre-processing re-calculates monthly prices for each SKU and each website (min price, max price, medium, median ), and then stores the results in tables, which are connected to Business Intelligence tools, used by the client’s Pricing Teams.
Read also: Data science & multidimensional analysis: the recipe to create optimal pricing
The aggregation engine integrated in these tools calculates the Market Price Index by executing the following calculation steps, using data from the pre-processing, compliant with the requirements of the Manufacturer’s Pricing experts : – The average price by time range – The average price by tyre dimensions – The average price by product – The median price by website – Association of market sales volumes – Calculation of the weighted average price per market volumes with application of the Range Parity (using the dimensional mix of the reference brand) |
Whether this aggregation is done using the entire price history or a specific time range and/or products subset, it usually creates serious issues for leading BI tools. They require calculation times ranging from 1 to 15 minutes just to display the evolutionary curve of the Market Price Index for the whole product scope and the whole data history.
With that kind of performance, it is impossible for Pricing Teams to dynamically analyse the index, for instance, by adding or filtering specific products, distributors and so on, for the purpose of seeing the impact in real time.
Migrating Toward an Optimized Aggregation Engine
With the aim of accelerating response time and providing Pricing Teams the capacity to dynamically analyze the index, Lizeo launched a benchmark of aggregation engines available on the market.
Among evaluated criterias, two were particularly crucial: the capacity to precisely reproduce the expected calculations and simultaneously, providing the ability to customise filtering criterias using a widespread programming language.
For this test, Lizeo began by replicating the calculations with another leading BI solution, and obtained similar results to its existing tools, Lizeo then proceeded to a thorough test of the Atoti solution in real life conditions.
In order to do that, Lizeo, supported by ActiveViam at each step of the process, deployed a test machine on Amazon Cloud, with characteristics equivalent to the physical machine used in production, and implemented the exact calculations for the Index in Python using Atoti, a complementary library to Jupyter Notebook.
To compare the results, Lizeo established a performance test plan, which consists of launching calculations on: – A data cube containing 6 brands, 41 websites, in a time range starting from 05/2009 to 06/2020 ( QV disk size 352 Mo – 774 Mo of Memory when loading) – A data cube with all available brands in Lizeo’s database, 41 websites, in a time range starting from 05/2009 to 06/2020 ( Size QV 914 Mo dik 3103 of memory when loading) Then play with filtering criterias: changing the reference brand, un-selecting a competing brand, in order to evaluate whether the solutions optimize the calculation time if part of the aggregation has already been done during a previous filtering. |
The test results are presented in the table below:
[wptb id=760]
Beyond Market Understanding, Simulating Scenarios to Improve the Product Marketing Strategy (pricing and assortments).
With the Atoti platform, Lizeo equipped itself with a technical asset allowing not only to optimize the performances of the market insights analytics which consume the most CPU resources, but also calculate them dynamically according to various scenarios, in a prospective analysis purpose.
Where traditional leading BI softwares only allow one to visualize and then crunch a data cube loaded in-memory, representing a historical state of the market, Atoti allows to either charge on-the-fly several cubes fitting various scenarios (for instance: sales volumes decreasing by X% on a market segment), or directly input the simulated data from its interface so as to simultaneously visualize and compare the results of the scenarios against a specific KPI.
A significant advantage when one wants to planify a product marketing strategy by, for instance, simulating what would be the effect of a product launch for a specific category, at a designated price level, or by visualizing the impact on the Market Price Index in order to evaluate how relevant the scenario is against the global positioning strategy.
More articles on similar topics:

