

Python notebooks are the best tool for data scientists, until they’re not. Streamlined, simple to use and fairly powerful when it comes to organizing and analyzing data, they nevertheless have several limitations:
- Visualization libraries don’t really let you explore the data interactively
- Pandas is great for data wrangling, but when data volumes get too big you have to start over in Spark
- It doesn’t natively support multi-dimensional analysis (pivot tables, multi-level hierarchies, comparing scenarios…)
My team and I are part of a Datalab at our company and those limitations get in our way all the time. We use other solutions that support those features (BI applications, Databricks, OLAP cubes…), but they don’t integrate well with each other and they don’t have the flexibility and ease-of-use of Python. So we circled back to the notebooks and looked for ways to improve them.
Integrating an OLAP Cube into Python Notebooks
Drawing from our experience building analytics applications, we decided against building specific widgets just for visualization or to work around data volume limitations. Instead we took a step back and tried to figure out what was missing from Python notebooks to make analysis at the same time easier, more powerful and more collaborative, starting with our own use in the Datalab.
Ultimately we decided that the best way forward was to try to integrate a full OLAP cube into Python notebooks. The benefits of this approach as we saw it were as follows:
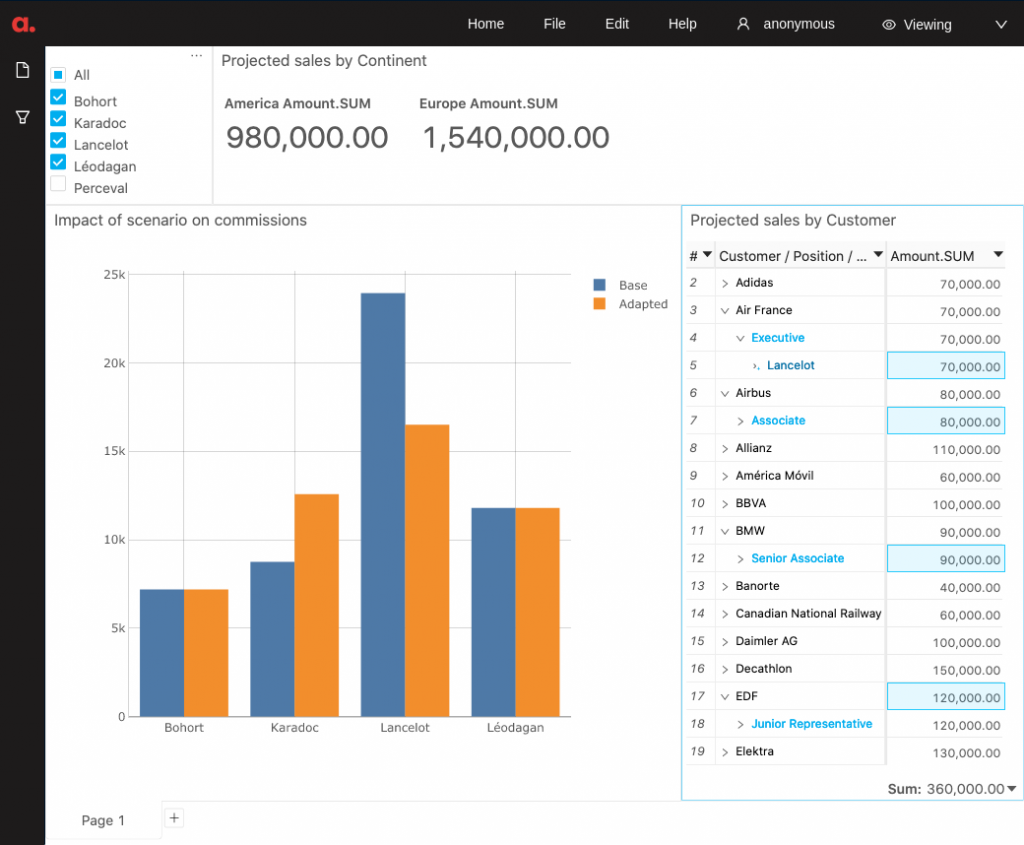
- It enables multi-dimensional analysis and visualizing multiple scenarios side-by-side
- Connected to a dashboarding suite, it allows users to have fully dynamic visualizations
- The resulting dashboards can be shared easily with other users for collaboration and prototyping
In addition, using the right OLAP technology would also let us overcome the limitations of data volumes.
Bridging Python and Java
We decided to go ahead and start with the OLAP technology we knew best, that we were confident could fulfill all those goals : our company ActiveViam’s aggregation engine, which combines transactional and analytical processing to handle ever-changing data in-memory, and our visualization interface. The aggregation engine is written in Java, a language that allows it to leverage hardware capabilities to their fullest but it requires some advanced training to use it properly. The goal was to integrate these technologies into a Python notebook as seamlessly as possible, without sacrificing any of its capabilities nor any of the notebook’s ease-of-use.
From this base, we built a new product called Atoti that takes the form of a Python library that users download and install like any other, coupled with a JupyterLab extension written in TypeScript. here’s how it works in four steps:
- Get some data from a file, a database or any Pandas dataframe
import pandas as pd
import Atoti as tt
session = tt.create_session("Sales Booster")
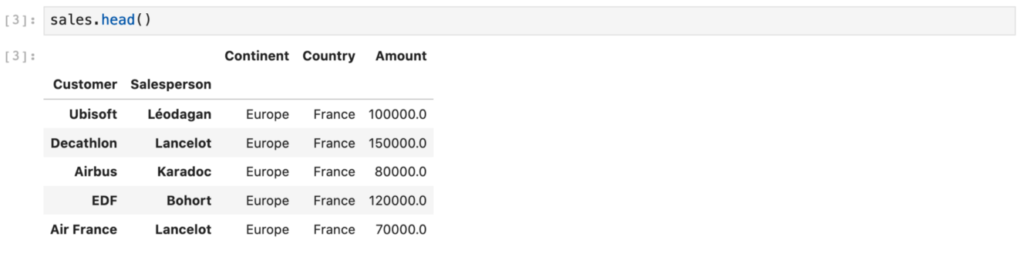
sales = session.read_csv(
"data/projected_sales.csv",
keys=["Customer", "Salesperson"],
store_name="Projected sales",
)
sales.head()
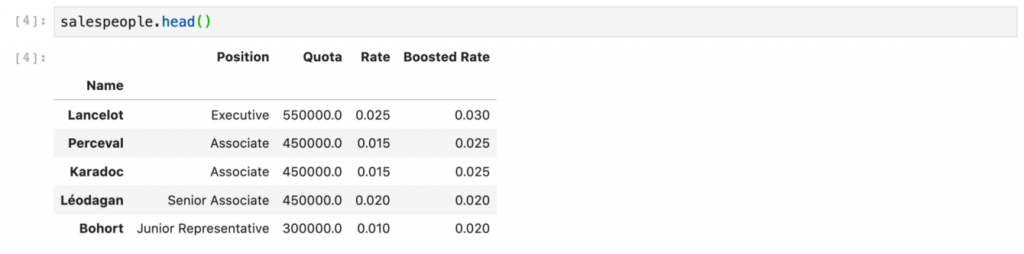
salespeople_df = session.read_csv("data/salespeople.csv")
salespeople = session.read_pandas(
    salespeople_df, keys=["Name"], store_name="Salespeople"
)
salespeople.head()
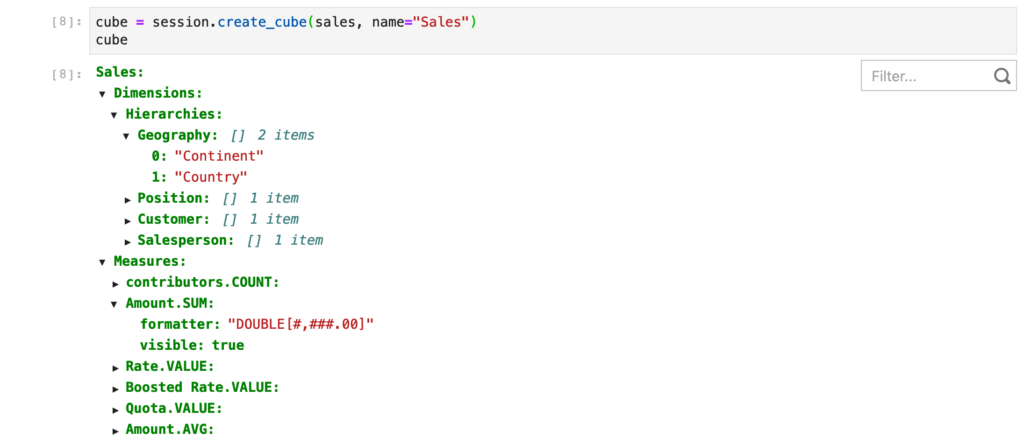
- Create a cube
- Start exploring interactively
- Create and share a full dashboard
The documentation for Atoti is available here
The user interface documentation is also available there
The changes to the notebook are immediate:
- Simple data-viz widgets such as pivot tables, tabular views, charts, etc. are displayed right there in the notebook (available in JupyterLab only)
- A full dashboarding suite opens alongside the notebook and responds dynamically to your Python code. It gives you dynamic visualizations and it’s very easy to share with other people even if they don’t use notebooks themselves
- Multi-dimensional analysis and ‘What-If’ scenarios are fully enabled
- Data volume limitations depend only on the hardware used and how much memory and CPU cores it has. With cloud-based services, users can load up to Terabytes of data.
You can also do much more such as joining multiple data sets together or defining complex aggregations using the Python API that will then become available from the visual environment.
We’ve written a documentation (link above) outlying all those options as well as the handful of Python commands specific to the library. The library was really designed to be accessible to all Python notebook users, from amateurs to experts.

