

Atoti meets Excel
Microsoft Excel is by far the most common tool for data analysis in the world. From the basic use of presenting data in rows and columns, using formula functions for calculations to summarizing results in pivot tables and charts, Excel is a great tool!
Atoti however now offers an alternative that combines the straightforward user experience of Excel with the capabilities of Python notebooks. With support for multidimensional data, complex aggregation and simulation and built-in dashboarding, it’s a full analytics suite in one convenient package.
When it becomes difficult for you to maintain and improve Excel workbooks, to handle big volumes of data and keep the analytical process interactive, it’s time to migrate to Atoti. Plus, if you always wanted to start learning a bit of Python, Atoti provides a gentle introduction.
Quick comparison
Quick Start
Once you have downloaded and installed Atoti, open the Jupyter notebook and load your most granular data into a cube. Please refer to the Tutorials for step-by-step instructions.
The data is stored in-memory and is quickly aggregated on the fly upon querying. Follow this link to learn how to create pivot tables and start analyzing.
What to expect?
Every time you run your Jupyter notebook, a cube with your data and aggregation functions will be created in-memory. You can browse and visualize the data within the notebook or in dashboards with the Atoti web application. You can easily inject more data, more aggregation functions and create analysis in a reproducible manner.
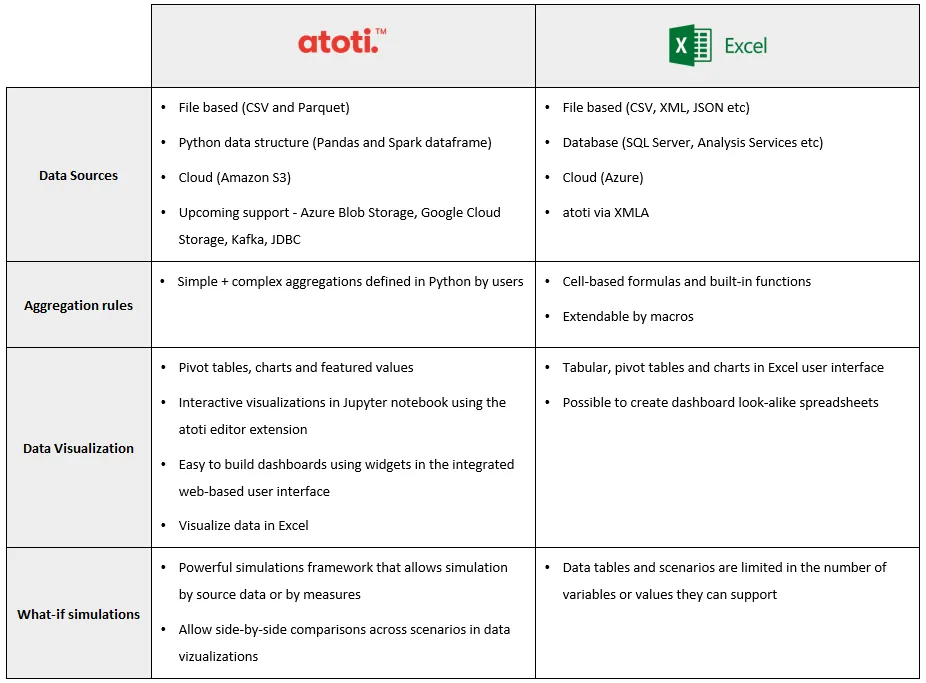
Data Sources
Both Excel and Atoti natively support various data sources, ranging from text files to cloud storages along with databases. While the supported data sources may differ, you can usually connect to any data sources via the one natively supported.
On top of that, it’s possible to use Excel to connect to Atoti and interact with the underlying data cube using its “Analysis Services” connector!
On a side note, Excel can support a maximum of 1,048,576 rows by 16,384 columns. Atoti on the other hand, with its in-memory data cube, can load as much data as the laptop or server resources offer. As such, Atoti is routinely used with hundreds of gigabytes of data.
User-defined aggregations
In addition to the default “SUM”, “ MEAN” and “COUNT” aggregation functions, you can make use of the wide range of aggregation functions provided by Atoti to perform your calculations. Alternatively, you can always tap into the vast resources of Python to pre-compute the results and feed it to Atoti.
By creating the measure once, you will be able to use it across all the data visualizations within the session.
Atoti gives you control over what you want to aggregate and how. For instance, in Animal Crossing, items can be purchased using either bells or miles. Since they are transacted in different currencies, their margins should not be aggregated together.
m["margin with stop"] = tt.agg.stop(m["margin"], l["buy_currency"])
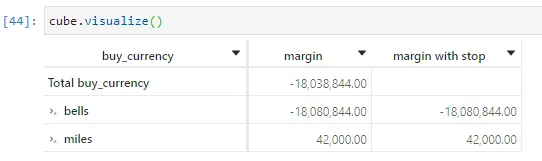
By applying an aggregation stop at the buy_currency level, there is no grand total generated for margin with stop. Read more about user defined aggregation functions in the Tutorial.
Data Visualization
Other than pivot tables, both Atoti and Excel allow data to be visualized in charts. Charts from Atoti are more interactive and dynamic comparatively speaking. They are backed by the data cube and are built on top of Plotly. Hence, the charts are more responsive and can support more data points plotting.
Atoti supports an alternative display of Pivot Tables, known as Featured values. This allows you to have greater visual impact on values that matters more and perform quick comparison between 2 members to give its trend.
You can easily interact with all the visualizations with the Atoti editor, as seen in the GIF above.
What-if Analysis
What Atoti really excels at is the scenarios, also known as What-if Analysis in Excel.
Dealing with Excel’s What-if Analysis feature, we see the following limitations:
- “Data Table” mode can only support changes for up to 2 variables but can accept multiple different values for these variables.
- “Scenario Manager” mode can support multiple variables but it can only take up to 32 values.
With Atoti’s powerful simulation framework, users can create simulation either by overriding the measures or uploading alternative data. The scenarios created exist in parallel, allowing users to perform intuitive comparisons across them.
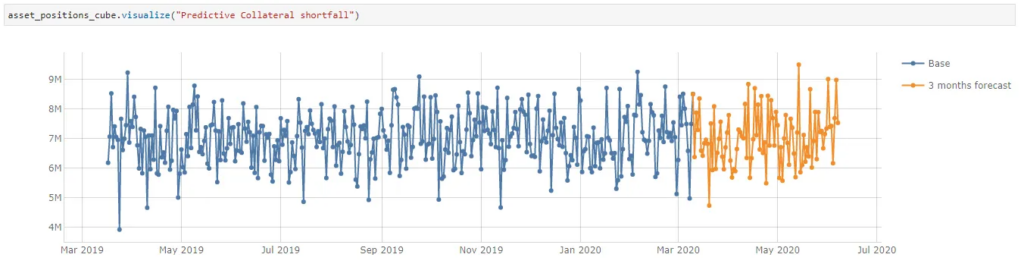
Scenarios from modified sources
Suppose you have a predictive engine that generates forecasts of data for a particular store and you want to see how the analysis will turn out. Using the same data structure as the original source file, you can load it as a scenario without having to restart the cube or duplicate data from other stores. All the measures that were defined in the cube will automatically be available for the scenario.
To see how the predictive data looks against the original data, use truncate to clear the store before loading it.
predictive_simulation = assets_prices.scenarios["3 months forecast"].load_pandas(
predictive_3_months, truncate=True
)
We can easily plot a chart to see how it pan out:
Scenarios by measure scaling
Atoti offers 3 options in measure scaling simulations , either you:
- replace a measure value
- scale the value by multiplying it with a factor
- add a fixed value to the original one
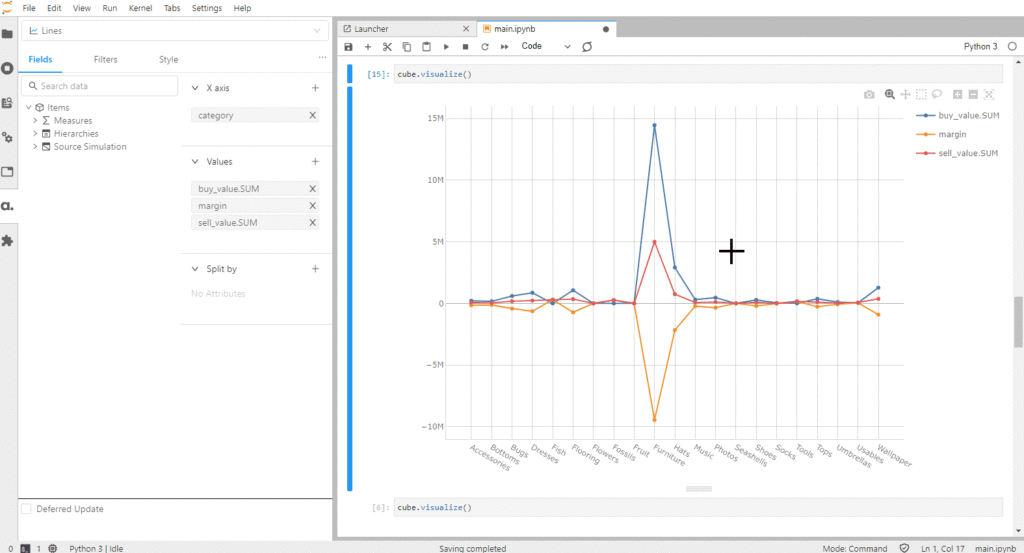
Let’s see how a simulation can be setup in which the buy and sell values can be adjusted for different categories of items:
margin_simulation = cube.setup_simulation(
"Margin simulation",
levels=[l["category"]],
multiply=[m["buy_value.SUM"], m["sell_value.SUM"]],
base_scenario="Original Margin"
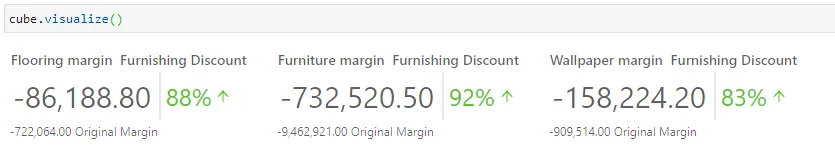
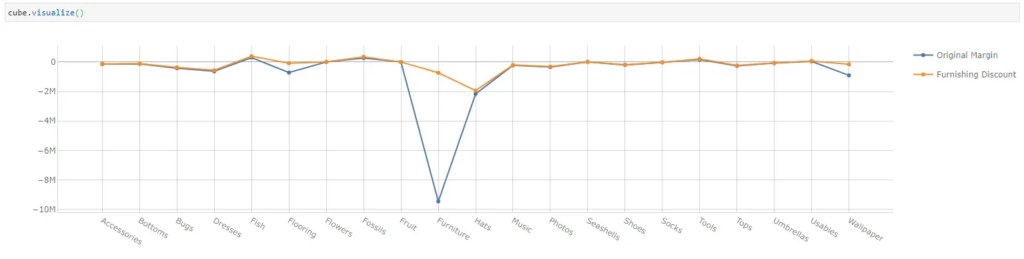
)Now suppose there is a promotion on furnishing where furnishing related products are selling at 50% discount and the sell_value.SUM for all products is increased by 30%.
So let’s scale the furnishing related categories to half its buy value and 1.3 times of its sell value.
discount = margin_simulation.scenarios["Furnishing Discount"]
discount.append(
    ("Flooring", 0.5, 1.3), ("Furniture", 0.5, 1.3), ("Wallpaper", 0.5, 1.3)
)
We use None as a wildcard value for the category level in order to increase the sell value across all categories.
discount += (None, 1, 1.3)
Finally we can chart the scenario against the original margin to see the differences:
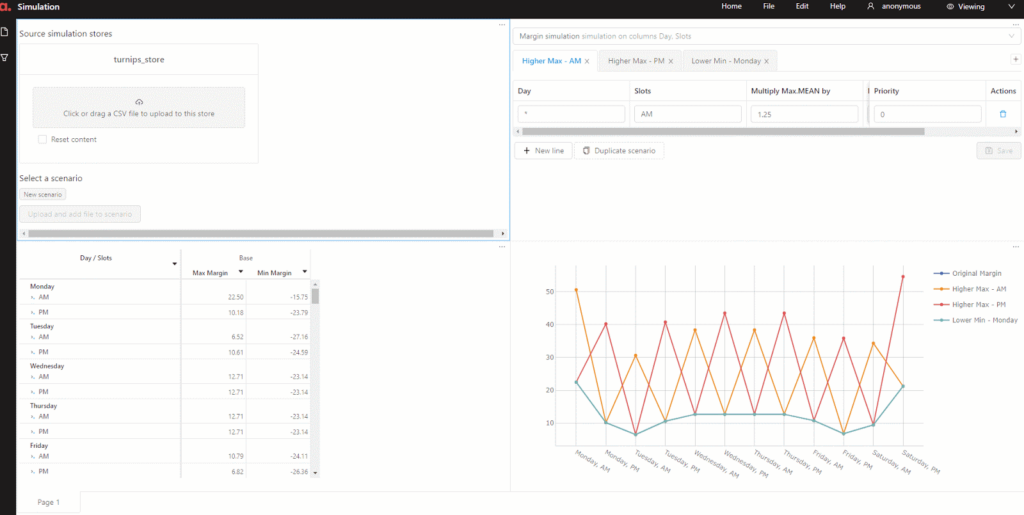
In the event where we prefer to interact with GUI rather than code, we can always switch over to the Atoti web application and run the simulations using the Measure Simulation or Source Simulation widgets.
Check out Atoti’s starting guide to find out more about performing simulation in Atoti.
Conclusion
As a Python library, Atoti can be combined with other libraries to create complex data models from various data sources. Bundled with its own web application, it allows users to build interactive and beautiful dashboards that can be shared with peers and stakeholders.
Ain’t you tempted to give it a try? It doesn’t mean you have to throw away Excel since you can connect it to Atoti as well!

