
Tearing down data silos to provide a unified view of the customer
Customer 360 is aimed at integrating customer data from disparate sources for an organization. We explore Customer 360 with a typical service provider scenario.
A customer can have multiple engagements with an organization. Each engagement may be handled by one or more departments within the organization. For instance, there’s the sales department that signs the engagement; then the finance department that manages the payment; finally the delivery team that runs the show. Each department requires different information to do their tasks and often, manages their own data, creating data silos consequently.
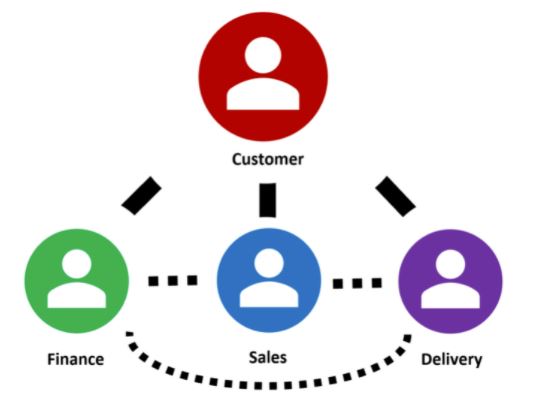
If Sales maintains their own customer relationship management (CRM) system that is not synchronized with the Finance and Delivery team, they may not be aware that a customer habitually defaults payment and probably should be avoided.
This disparate source of information creates a gap in communication across the department, potentially affecting the customer experience. Therefore, there is a need for Customer 360, where data sources are centralized to provide a holistic view of the customer.
Follow along as we seamlessly achieve this arduous task using Atoti.
What is Customer 360?
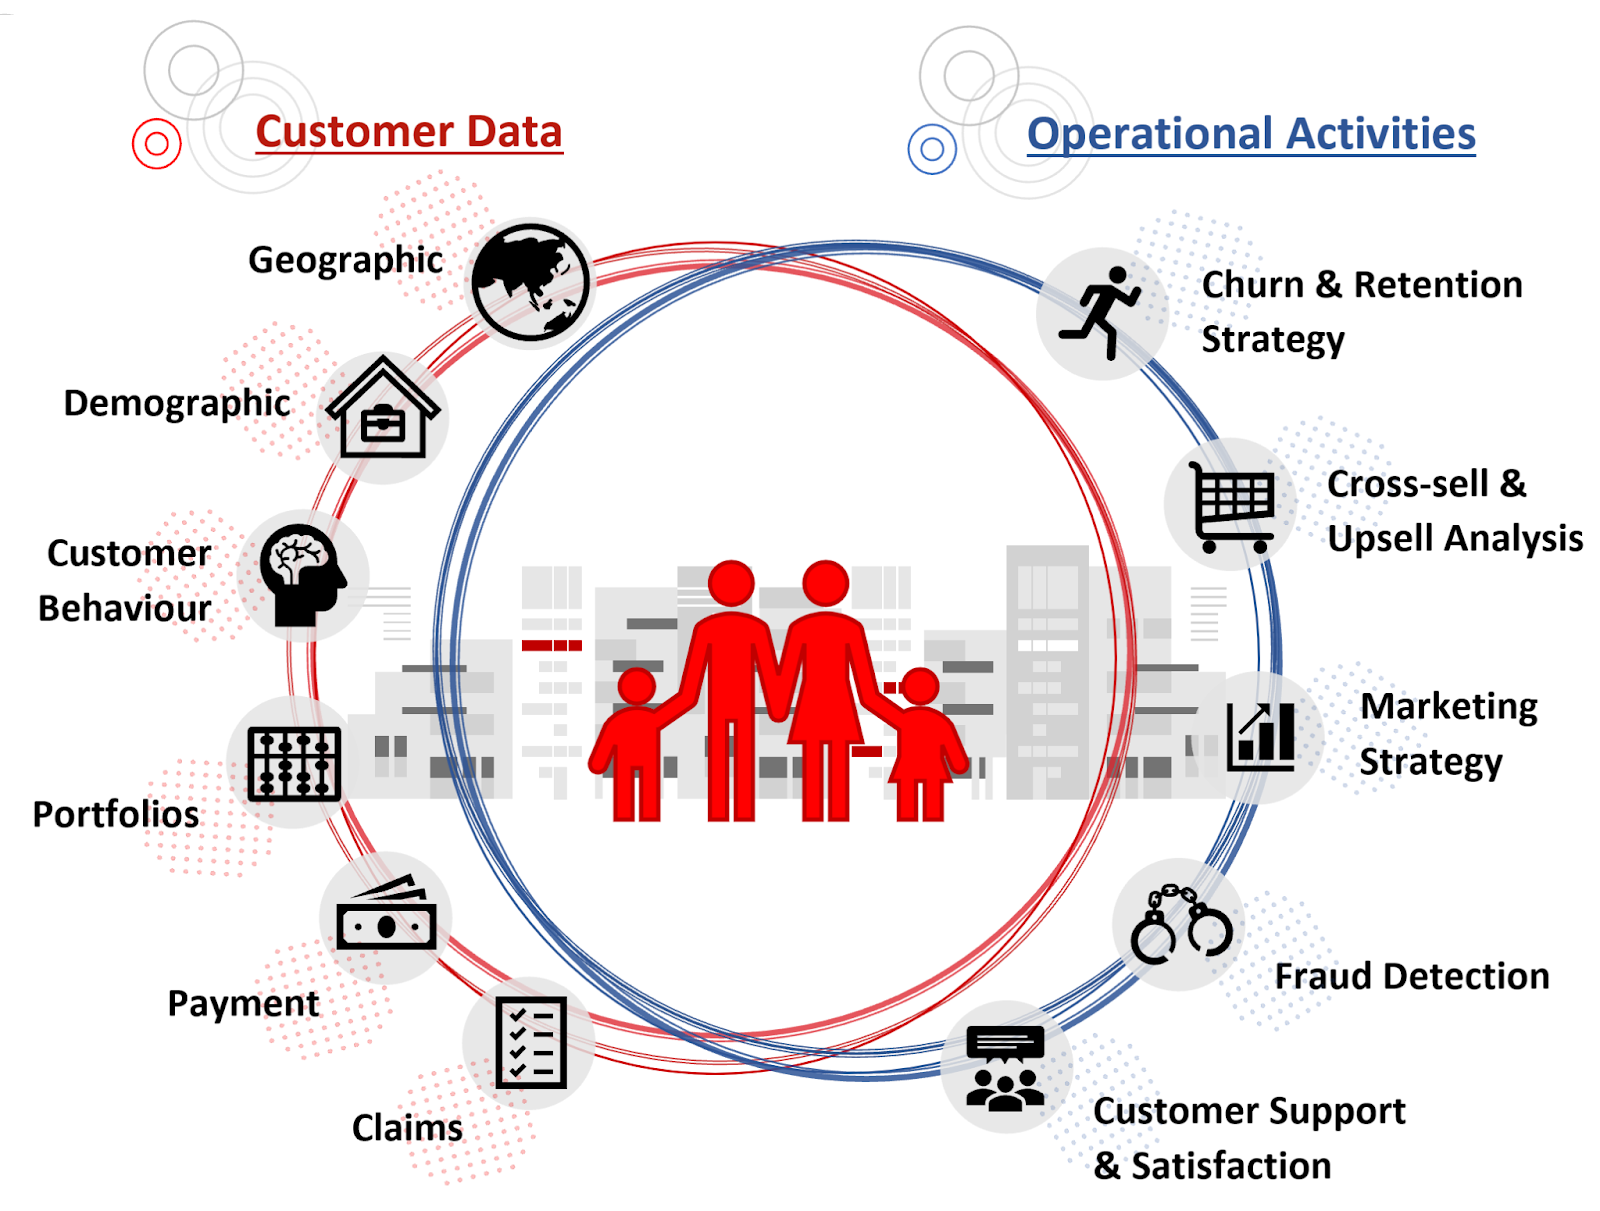
Customer 360 consolidates the data pertaining to the customer across all the departments – sales, customer service, delivery, finance, legal etc. This allows the organization to perform unified analyses of the customer in order to carry out various activities as shown below:

Machine learning can be applied to the golden data source to:
- predict potential churning of customer
- create cross-sell and upsell recommendation
- detect fraud
- analyze customer sentiment and needs based on communication logs
Through machine learning and analysis, the ultimate goal of Customer 360 is to retain customers, grow the existing customers and acquire new customers. Also, at the same time, it helps to reduce the organization’s risk of losing money to fraudulent cases.
Challenges in achieving Customer 360
Dealing with data is not always easy. Below is a list of challenges typically faced when building Customer 360:
- Collecting and integrating data from various sources amidst stricter privacy and data governance rules.
- Standardizing the data taxonomy where different data sources may have different classifications.
- Cleaning the data where the same customer may be named differently in different systems or some of the profile information are out of sync.
- Ensuring the efficiency of the system in handling the increasing data volume with IOT.
- Handling of the ever-changing data, such as regulatory changes, risk evolution, customer churn etc.
Building Customer 360 for insurance with Atoti
While Customer 360 is applicable across industries, we are going to build a scaled-down Customer 360 Insurance mock use case with Atoti using data in various formats. You can find the technical implementation under the Atoti notebook gallery.
Since most of the challenges reside with data integration, we will not be showing how machine learning is integrated into the system.
So, why use Atoti? Because it is a powerful Python BI analytics platform that allows us to perform multidimensional analysis. Also, it’s free.
We will be building the following two-paged dashboard:


Use case description
Other than the customer data, we will be looking at three types of policies in this use case:
- Life insurance
- Property
- Vehicle
We assume that these 3 policies are maintained in different database tables and have different properties. Below is the schema that we will be building on top of the various data sources.

Life insurance policies
We only have the policy details for this policy type.
Property policies
Customers can have additional coverage for themselves and their families at discounted rates. The main purpose of this policy type is to show how we can show related policies as well as related customers.
We also look at the coverage of the insurance.
Vehicle policies
We have the claim data for vehicle policies. Based on the last claim date, we compute the no-claim discount (NCD) to get the resultant premium for the customer.
Data Integration
Atoti supports multiple connectors:
- CSV
- Pandas
- Parquet
- NumPy
- Spark
- SQL
- Kafka for real-time data stream
- More to come
In case a data source is not in the list, we can easily find the corresponding Python library to consume the data and convert it into a Pandas DataFrame. Likewise, we can perform ETL in Python before loading into Atoti if necessary.
In the Atoti notebook gallery, there are two versions of the same use case. One mainly consumes data from a relational database, and the other from CSV files.
“Data overloading” from different data sources into one table
Let’s take a look at how we can manipulate the SQL query to overload the same Atoti table with data from different tables.
policy_tbl = session.read_sql(
    """SELECT CUST_ID , PP.POLICY, POLICY_STATUS, 'Property' AS POLICY_TYPE,
    DATE(QUOTE_DATE) AS QUOTE_DATE, DATE(COVER_START) AS COVER_START,
    DATE(LAPSED_DATE) AS LAPSED_DATE, DATE(CANCELLED_DATE) AS CANCELLED_DATE, DATE(MATURITY_DATE) AS MATURITY_DATE,
    PAYMENT_METHOD,PAYMENT_FREQUENCY,SUM_INSURED,OWNERSHIP,PLAN_TYPE,BASIC_PREMIUM, NUM_SUBPOLICY, 'N' as IS_SUB
    FROM POLICY_PROPERTY PP
    LEFT JOIN (SELECT POLICY, COUNT(DISTINCT(SUB_POLICY)) AS NUM_SUBPOLICY FROM ADDITIONAL_COVERAGE GROUP BY POLICY) ADDONS ON ADDONS.POLICY = PP.POLICY;""",
    url="jdbc:vertica://192.168.56.101:5433/VMart?user=dbadmin&password=password",
    table_name="policy",
    keys=["CUST_ID", "POLICY"],
    driver="com.vertica.jdbc.Driver",
)
In the SQL query above, we have done a few things to the POLICY_PROPERTY table:
- performed a left join to obtain the number of sub-policies associated with the principal policy
- leverage the Date function to cast the data type for the date columns
- created a new column
IS_SUM
The snippet creates a policy table and we are going to load more data into this table. Since we can load data from multiple data sources into the same table, we will demonstrate this by loading the other policy types using Pandas DataFrame.
other_policies = pd.read_csv(
    "https://data.Atoti.io/notebooks/customer360/Policy_life.csv"
)
other_policies = other_policies.append(
    pd.read_csv("https://data.Atoti.io/notebooks/customer360/Policy_vehicle.csv")
)

other_policies["QUOTE_DATE"] = pd.to_datetime(other_policies["QUOTE_DATE"])
other_policies["COVER_START"] = pd.to_datetime(other_policies["COVER_START"])
other_policies["LAPSED_DATE"] = pd.to_datetime(other_policies["LAPSED_DATE"])
other_policies["CANCELLED_DATE"] = pd.to_datetime(other_policies["CANCELLED_DATE"])
other_policies["MATURITY_DATE"] = pd.to_datetime(other_policies["MATURITY_DATE"])

policy_tbl.load_pandas(other_policies)
Few things to note from the above snippet:
- We load data incrementally into the same table with the table function
load_pandas. - Instead of concatenating the CSV with Pandas, we can trigger the table function
load_csvto load each file separately. - Atoti is strict on the data type. Therefore, we cast the date types before loading the data into the table.
So, once that’s done, we have 3 different policy types in the same table. All the data is held in memory to enable speedy querying and aggregation operations. Check out the comparison of Atoti against ClickHouse.
To show further how we can transform data with Atoti, we manipulate the SQL query below to load the additional coverage as sub-policies into the policy table, with the IS_SUB flag set to “Y”:
policy_tbl.load_sql(
    """SELECT A.CUST_ID, A.SUB_POLICY as POLICY, P.POLICY_STATUS, P.POLICY_TYPE, DATE(P.QUOTE_DATE) as QUOTE_DATE, DATE(P.COVER_START) as COVER_START,
    DATE(P.LAPSED_DATE) as LAPSED_DATE, DATE(P.CANCELLED_DATE) as CANCELLED_DATE, DATE(P.MATURITY_DATE) as MATURITY_DATE,
    P.PAYMENT_METHOD, P.PAYMENT_FREQUENCY, A.ADD_SUM_INSURED AS 'SUM_INSURED', '' AS OWNERSHIP, A.ADD_COVERAGE_TYPE AS 'PLAN_TYPE',
    CASE WHEN A.RELATION <> 'Insured' THEN 0 ELSE A.PREMIUM END AS 'BASIC_PREMIUM',
    A.RELATION, 0 as NUM_SUBPOLICY, 'Y' as IS_SUB
    FROM ADDITIONAL_COVERAGE A
    LEFT JOIN POLICY_PROPERTY P ON A.POLICY = P.POLICY""",
    url="jdbc:vertica://192.168.56.101:5433/VMart?user=dbadmin&password=password",
    driver="com.vertica.jdbc.Driver",
)
Finally, we used the alias to rename the columns.
Creating joins to referenced tables
We have multiple tables in our final schema as shown earlier. This is achieved by reading data into new tables and creating the join:
addons_tbl = session.read_sql(
    """SELECT A.POLICY, A.SUB_POLICY, A.ADD_SUM_INSURED, A.ADD_COVERAGE_TYPE, A.PREMIUM, A.RELATION, A.CUST_ID as 'INSURED'
    FROM ADDITIONAL_COVERAGE A""",
    url="jdbc:vertica://192.168.56.101:5433/VMart?user=dbadmin&password=password",
    table_name="additional_coverage",
    keys=["POLICY", "SUB_POLICY"],
    driver="com.vertica.jdbc.Driver",
)
policy_tbl.join(addons_tbl)
We use this table to maintain the relationship between the principal policy and the sub-policies.
Reference table for age groups
We compute the age of the customer via the SQL function AGE_IN_YEARS(DOB::DATE) as AGE from Vertica database. Since age is at the granular level, we can create a reference table that creates age groups for broader analysis:
age_groups_tbl = session.read_pandas(
    pd.DataFrame(
        data=[("0-17Y", i) for i in range(18)]
        + [("18-64Y", i) for i in range(18, 65)]
        + [("65Y+", i) for i in range(65, 100)],
        columns=["AGE GROUP", "AGE"],
    ),
    table_name="Age_Groups",
    keys=["AGE"],
)

customer_tbl.join(age_groups_tbl)
In this case, we join the age_groups_tbl to the referenced table customer_tbl.

Atoti infers the join using the column names. We can always explicitly declare the join by setting its mapping.
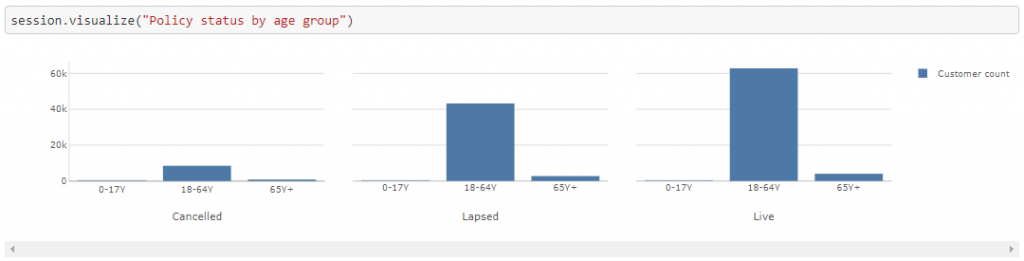
Thereafter, we can perform analysis using age groups:
Data cube creation
We create the cube by setting the table with the most granular level of data as the base table:
cube = session.create_cube(policy_tbl, "Insurance")
With the data loaded in the created cube, we start performing some data exploration.

Data aggregation with Atoti
In addition to the measures that are uploaded from the data source, we can also derive new measures. Let’s look at a simple example where we get the number of policies by their status, so as to compute the termination rate.
h, l, m = cube.hierarchies, cube.levels, cube.measures

m["Number of lapsed policies"] = tt.agg.sum(
    tt.where(l["POLICY_STATUS"] == "Lapsed", m["contributors.COUNT"]),
    scope=tt.scope.origin(l["POLICY"]),
)

m["Number of cancelled policies"] = tt.agg.sum(
    tt.where(l["POLICY_STATUS"] == "Cancelled", m["contributors.COUNT"]),
    scope=tt.scope.origin(l["POLICY"], l["POLICY_TYPE"]),
)

m["Resiliation rate"] = (
    m["Number of lapsed policies"] + m["Number of cancelled policies"]
) / m["contributors.COUNT"]
m["Resiliation rate"].formatter = "DOUBLE[#.00%]"
Tada! We can see the termination rate for each policy type over the years:

Data Visualization with Atoti
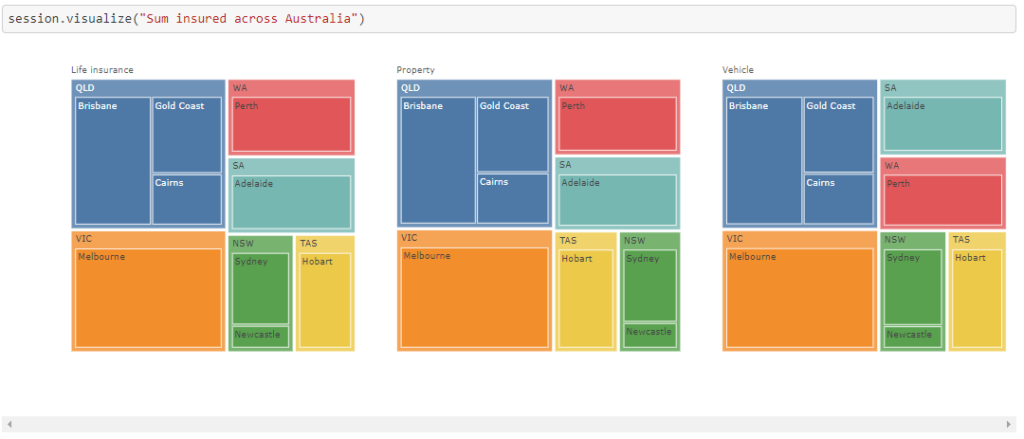
Atoti has a custom JupyterLab extension that allows us to interact with the visualization in the notebook:

Some visualizations that might interest you:

Creating dashboard for Customer 360
Atoti is a full BI analytics platform, which means it also comes with a web application that allows users to perform data analysis via dashboards. To access the web application, we can simply run the code session.link( ) to access its URL.

We can either build new visualizations within the web application; or export those that we have created in the Jupyter notebook earlier on:

Among other things
It would be interesting to explore the topic further by integrating it with machine learning. We can always upload the prediction into the cube and define some KPIs to leverage the prediction. To get a better idea, you can refer to the customer churn notebook.
In addition, we can also export aggregated data from Atoti to Pandas DataFrame for machine learning:

For advanced use cases, we can always explore Atoti+.


