

As a range of tools aimed at supporting data accessibility spring up, we explore data democratization within the larger trend of technology democratization.
Neither technology democratization nor data democratization are new terms. LinuxInsider touched upon both during a 2011 podcast. Bernard Marr wrote about data democracy for Forbes in 2017. IT Business Edge wrote about it as recently as this year, in 2022.
So what is data democratization?
Data democratization is the trend of increasing access to data to non-technical or non-traditional users. It indicates an ease or approachability for all members of an organization to data. Data democratization is part of a larger trend of technological democratization, where technological advances are accessible to non-technical users through intuitively designed products. The growth of self-service and no code systems developed today reflects this trend.
For a (very old!) example of technical democratization, sites like geocities helped democratize website building for non-technical users. It allowed someone with no experience with HTML to build an HTML website through an almost MS Paint like experience.

GeoCities enabled website building for anyone
For a more modern example, workflow builder unQork. It utilizes a drag and drop experience for building out complicated enterprise workflows, creating a no-code experience for workflow configuration.
Data Democratization
Data democratization is a subset of technical democratization which focuses on how users can access and understand their possibly-large datasets.
As the amount of data an enterprise manages increased, being able to derive insights became a more complicated challenge. Simple reports require a technical expert or a team to corral data from multiple sources, cleanse or standardize it, then run it through whatever analytics the business user desires.
For example, take a simple case of customer 360 within the insurance industry. Hypothetically, for an insurance company, prospecting store contains the onboarding data. The active accounts store contains current policies, possibly using multiple stores for multiple types of policies, one per policy type. Each of these stores could have been set up by a different data engineering team, using a different data model. Each could have different levels of security protocols for who may or may not be able to access the information. To get a holistic view of even one customer’s jouney within the company, a reporting team would have to pull data from many silos and unify it before deriving any insights. Ideally, this happens with safeguards in place to ensure none of the underlying data is altered.
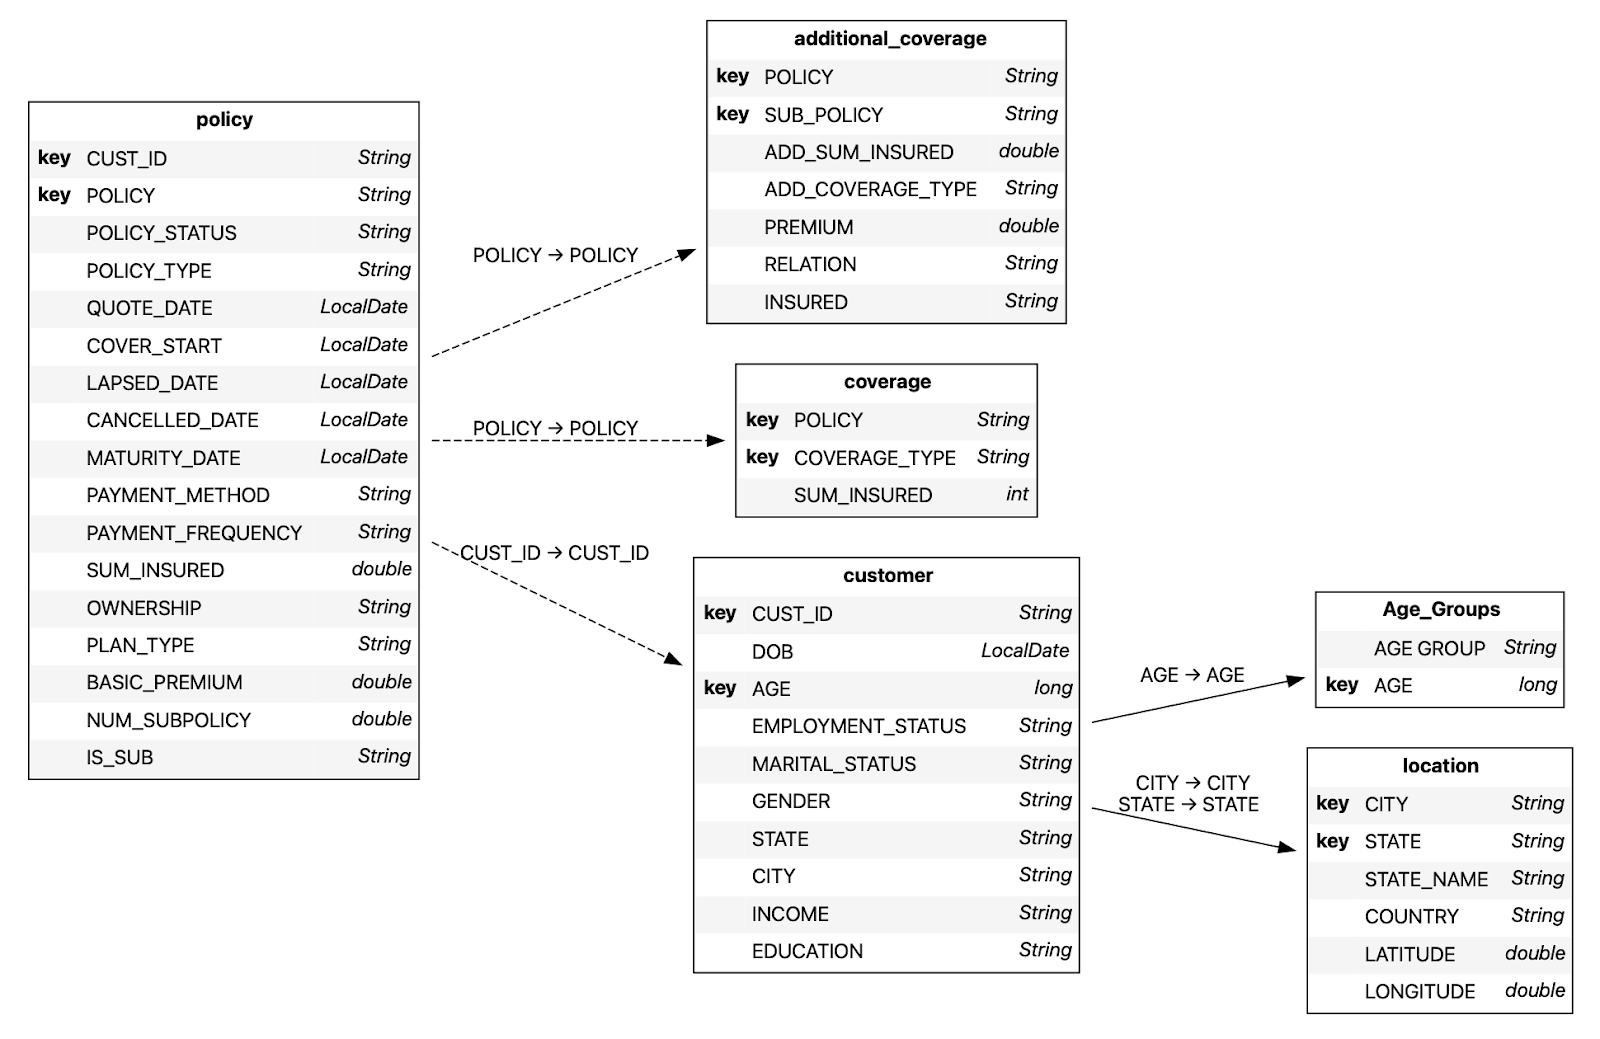
Its Challenges
This task sets up a barrier between the potential wealth of insights held within the data and the business user who wants to extract and harness these insights. Self-service analytics platforms try to address this barrier, by allowing data consumers access to the data which they wish to study. Business organization find themselves navigating a fundamental question: do they want a single source of truth, or do they want their data maintained separately in data silos? Data democratization is not as simple as loading all data into one centralized repository and giving users access via some lovely GUI.
Consolidated or silos
While utilizing a single source of truth strategy may appeal to many, there are legal and logistical reasons which warrant silos. Ethical wall policies and laws, data integrity concerns, and storage and update related headaches all contribute to businesses choosing silos.
For example, with ethical walls, a company prevents a team whose mission conflicts with another team’s mission, such as a marketing firm managing campaigns for two competing clients. Here, the each team should only have access to their own client’s campaign.
Even without ethical walls to prevent separate data storage, it may be impractical to continually update and maintain a centralized golden source. Data integrity requires knowing who has access to updates, and at which points. An errant user change in one system can lead to many users accessing bad quality data.
Storage concerns
Even with appropriate access management, syncing data requires bandwidth and storage space. For example, transactional data for accounts can grow large over time, especially if account data requires nightly processing. Maintaining a single source of truth could lead to undue system burden, both for the continual updates as account transactional data updates nightly, and during query run time for unrelated information such as a report on account owners’ nationalities.
Regardless of the strategy, each business organization has to determine the appropriate measures of access control, and how many layers of control they wish to maintain. Basic firewall based access control allows anyone on the network to access the data, for straightforward control. Or, customized control set up at the data and UI layer for more granular control.
Overcoming the hurdles
So, what is necessary for a technology to address this? What are the hallmarks of a product democratizing data?
Ideally, such a product enables rapid self-development, limiting or removing dependence on IT departments. One such method is to ensure easy connectivity to data, both locally stored and cloud stored. This reduces the need to collect and transform data. It provides ease of modeling: simple table joins, easy column selection and renaming, and, post data collection, automated or easy to set up insight creation. Performance should be front and center. No one wants to wait for their analytics. And most importantly, it should be intuitive, with a rich GUI experience. Over the last few years, user experience made its way to the front and center of design. Its growth is projected to continue. And for good reason: a non-intuitive UI requires costly and time consuming training, adding a barrier to adoption. Intuitive design empowers users to explore the technology, and utilize it fully more readily.
One such example? The python library Atoti. With many connectors for data access and an intuitive data modeling process, it is easy to get started. Coupled with a friendly jupyterlab widget and dashboarding webapp, users easily intuit how to create their own visuals and dashboards. And with the performance to match, Atoti bridges the gap between data analysts and scientists and their business user colleagues.
Curious about Atoti? Check out our tutorial on the Atoti website, or head over to our youtube channel to get started.

