

Brick-and-mortar retailers face more and more competition from e-commerce.
Starting a war on prices is a bad idea as e-commerce retailers do not have the same structural costs, allowing them to propose lower prices.
On the other hand, traditional retailers do not offer the same service: people can test, touch and examine products, and do not have to wait for a delivery.
So how to take into account the fact that customers’ behaviour has changed and that they might compare some products’ prices with competitors’ offers on the web?
In the first section of this article, we will use the sales data that any retailer has to classify products according to how often customers compare their prices online before purchase.
Then in a second section, we will test with Atoti whether we can build successful pricing strategies using the product groups from the classification.
Classifying the products
In this section we describe a classification algorithm where we start by using checkout receipts to score products depending on customers’ purchase behaviours. From there we use this scoring to classify products into three groups with different sensitivities to web price comparison.
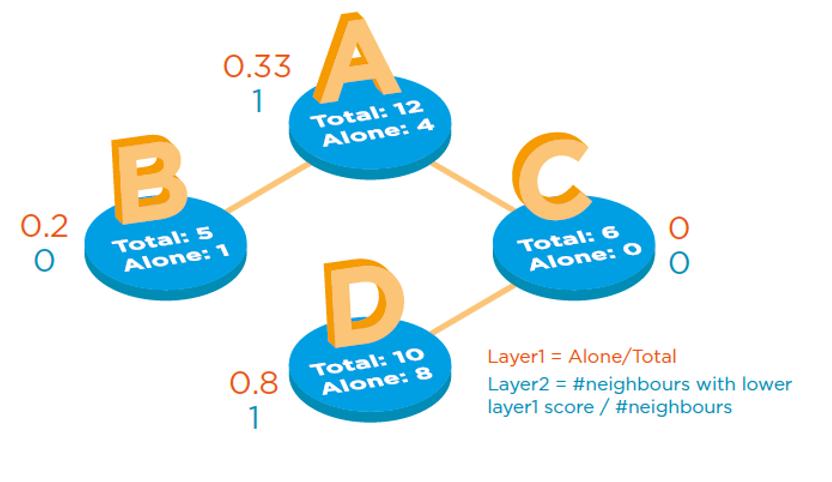
First axis: A product is scored depending on its tendency to be sold primarily alone, or with other products in the same receipt. We do this by calculating the ratio between the number of times the product was sold alone and the total number of sales of this product.
Second axis: Here, products are scored based on whether they were normally sold with the same set of other products, or with a wide variety of other products. We achieve this by counting the number of neighbors (products in the same receipt) with a lower scoring on the first axis, and dividing it by the total number of neighbors.
These scores enable us to identify three groups of products in the catalog (note that in this picture, if we call Scoring2 the second scoring, the Y axis shows ep2 = 1-Scoring2):
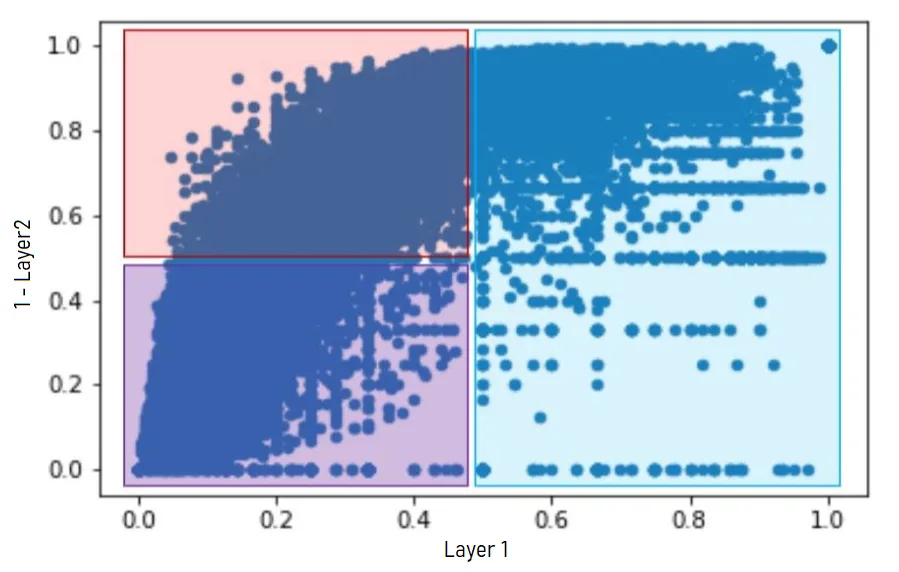
“Driver” products (in red): Those products are not sold alone, and often sold with the same set of other products. An example for DIY stores is a drill: when people buy a cordless drill the data shows they will often buy corresponding accessories, such as additional batteries.
Complementary products (in purple): Those products are also not sold alone, but sold with a large variety of other products. Examples in our dataset would be the drill batteries. Sometimes people buy those accessories together with the drill, but sometimes they buy the battery as an extra while going to the store for another reason.
Isolated products (in blue): Those products are most often sold alone. A closer look shows that they are often large and heavy products such as lawnmowers or garden sheds. It seems that the main reason they are bought alone is that customers simply can’t carry anything else.
We load the results of this classification into Atoti:
classified_products_store = session.read_pandas(classified_products, keys=["ProductId"], store_name='classified_products')
Join it with products wholesale and retail prices.
classified_products_store.join(wholesale_prices_store, mapping = {"ProductId": "ProductId"})
classified_products_store.join(retail_prices_store, mapping = {"ProductId": "ProductId"})
Create an OLAP cube on it to later enable multi-dimensional analysis
products_cube = session.create_cube(classified_products_store, "products_cube")
And proceed to do some analysis in a few lines only using the Atoti integrated UI
products_cube.visualize()
We can explore data in details dynamically, let’s take a closer look in a pivot table:
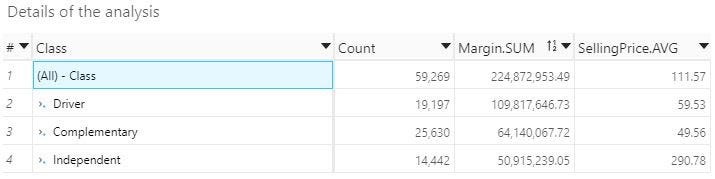
NB: Like the rest of the dataset, margin and price figures have been anonymized
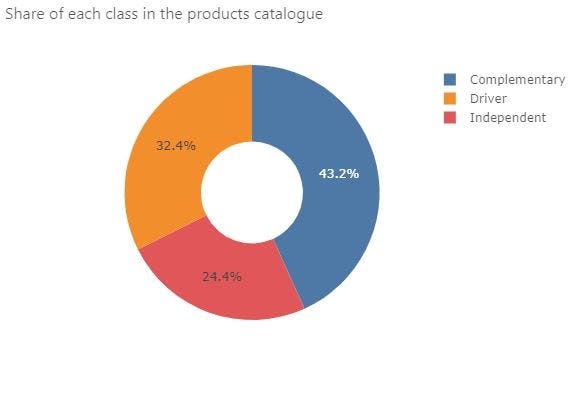
In this example, most of the retailer’s margin comes from driver products which are supposed to be the most compared. On the other hand, the complementary products account for 43.2% of the catalog but representa bit less than half the margin of the driver products.
Given this situation, there is some room to be more competitive on the driver products and still make a reasonable margin overall. The margin lost on the driver products can be compensated by increasing the margin on complementary products. This is what we will do later but first we must compute our price index to see how we are positioned against competitors.Having products classified into 3 classes is great but there is no value in this as long as we are not doing anything with these groupings.
The next section aims at estimating the effects of various strategies that take advantage of the classification to calculate new prices.
Assessing the impact of different strategies through simulations
To make sure our simulations work, we will first compute the price index with Atoti.
There are different existing formulas for a price index but the idea is always the same: the price index is a measurement of a retailer’s price positioning compared to one or several of its competitors.
The price index formula we use in this example compares a product price to the average price found among competitors.
We further weight the price index indicator by the margin when aggregating above product level so that we later optimize the price index for products that contribute the most to our margin (see formula below).
Other commonly-used formulas weight by sales volumes or revenue.
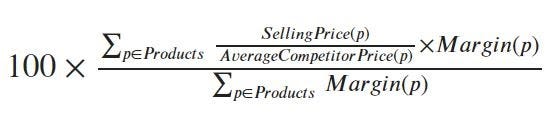
Though the formula can be translated into pretty much any tool, the fact that the indicators inside the sum have a different value per product makes it more difficult than it seems to compute. We would usually have to first compute the sum of the margins per product, then the average competition price per product, then make the overall sum and divide by the total margin. In Atoti, aggregating differently depending on the level is pretty easy and the global sum in the numerator can be described in one line:
m["Price Index Numerator"] = Atoti.agg.sum((m["Average selling price"] * m["Margin.SUM"])/ m["CompetitorPrice.AVG"], scope=atoti.scope.origin("ProductId"))
We then only have to multiply by 100 and divide by the margin indicator to compute the price index:
m["Price Index"] = 100 * m["Price Index Numerator"] / m["Margin.SUM"]
Below are the results we find when viewing the results in the Atoti UI:
The current situation is that driver products are the ones with the highest price index. As driver products are supposed to be bringing traffic into stores and be more price-compared than other categories, their price should rather be more competitive. On the other hand complementary products are 1.5% cheaper than the market average. This is not optimal, as being competitive on those products is less important.
We made two simulations of new prices trying to rectify the situation and assess whether they would bring better performance.
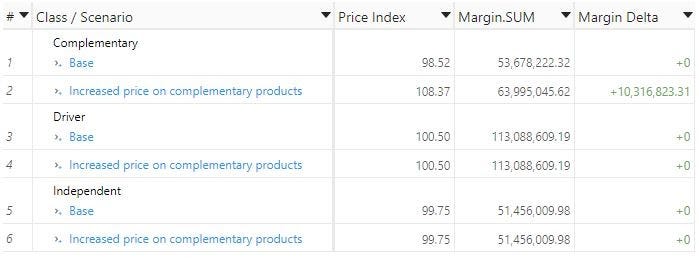
Simulation #1: Assessing potential margin gains on complementary products
This first simulation consists in increasing the prices of complementary products by 10%. Since this product class is less price sensitive, sales volumes should not drop. The goal of this strategy is to assess the maximum potential gains in margin or revenue we could generate from the classification.
We therefore used a custom pricing method to generate a new price list with 10% increased price on complementary products.
To perform this simulation with traditional systems, we would often have to first duplicate our whole dataset. Then edit the retail prices table to apply the 10% price increase on the complementary products. And then re-launch a batch calculation of all the metrics on this new simulation dataset. From there, depending on the system we would finally be able to compare the metrics of the new dataset with those of the initial.
Simulating with Atoti on the other hand is particularly easy: we simply have to tell Atoti that we want to create a simulation with a different retail prices table.
retail_prices_store.scenarios["Increased price on complementary products"].load_pandas(retail_prices_up_10%_on_complementary_products)
And that’s it! A new simulation has been created. We did not have to copy the whole dataset, only what matters has changed in the background. All the KPIs are recomputed in real-time as you explore the data in the UI or query it, and a “scenario” analysis hierarchy has automatically been created to let us compare multiple scenarios.
We will use this hierarchy to compare our results with the base scenario:
Simulation #2: Finding more competitive prices while maintaining the same margin
The initial goal was to be competitive against e-commerce competitors. In order to do that we will generate a second price list where we strike a balance between lowering the prices of driver products and independent products, and then compensate by increasing the price of complementary products by the same total amount.
We load this new price list in Atoti to perform the simulation:
retail_prices_store.scenarios["Optimized price index"].load_pandas(retail_prices_for_optimized_price_index)
And visualize the results in the Atoti UI:
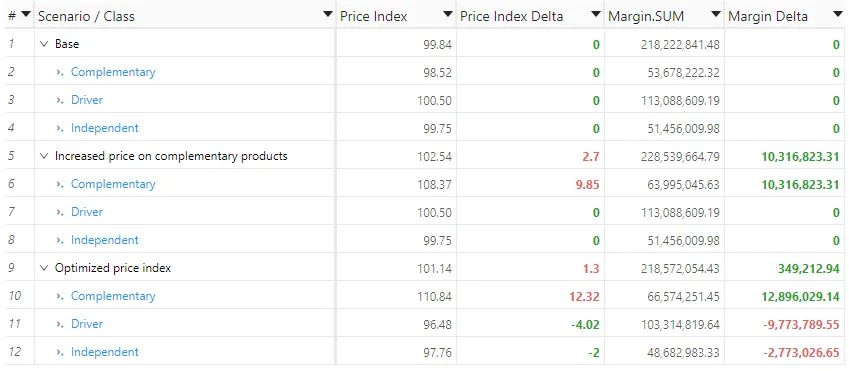
Goal achieved !
In this scenario we decreased the price index of driver products by about 4%, putting them in a more competitive position, while also lowering the price of independent products to reach an overall index of 97.76. The great thing for the retailer is that he can do it without sacrificing any margin, and even increasing it a bit (by 300k euros per year). This is possible by compensating for these price reductions by an increase in the prices of complementary products, that now sit about 10% above the market average.
If you wish to see the simulations live, you can have a look at our notebook on this topic and download Atoti for free!

