
As business or data analysts, there are times when we are presented with a set of data and asked to provide some insights from it. Not only do we have to present our findings to the business users, we often have to account for their technical credibility.
“Technical” credibility here means for instance the formulas that were applied, the integrity of the data and scalability etc. Business-wise, it would typically be the key performance indicators that drive the business.
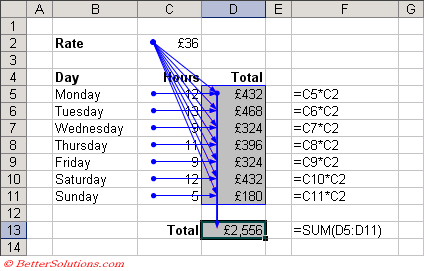
The most common way to do so is with Microsoft Excel. We can create formulas, generate charts and pivot tables. Click on a cell and it shows the underlying formula. But… What if we have a chain of formulas? Would you show your colleagues the below screen full of arrows, showing the flow of data and then displaying the underlying formula one by one?
Performing data analysis in Jupyter notebook
If you are into Python, Jupyter notebook is a good tool for presenting solutions to technical users and, maybe, business users who don’t mind looking at some code.
Although the non-linear workflow of the Jupyter notebook may cause some confusion (or disrupt work totally) when we jump sequence in executing the cells, it provides clarity in the way data can be explored alongside the constructs of the various business KPI. In a way, it is technical storytelling with some visualizations added to it.

Python libraries to explore
Python has a vast source of open-source or free software available for use. Some of the libraries include Pandas, Apache Spark, NumPy for data manipulations and Matplotlib or Seaborn for visualization.
Of course, there is also Atoti, which has the capability to consume large data volume and is bundled with drag-and-drop visualization and dashboarding functionalities. This means that we just have to learn and use a single library to perform our analysis.
- Read Introductory guide to Atoti BI web application for more information on its dashboarding capabilities.
- Access Atoti notebook gallery for examples of storytelling within Jupyter notebooks.
Presenting implementation to Technical audience
Using Atoti, we will show you how we can start performing data analysis with a few lines of code and present our implementations to a technical audience.
Spinning up a multidimensional data cube with Atoti
import Atoti as tt
session = tt.create_session()
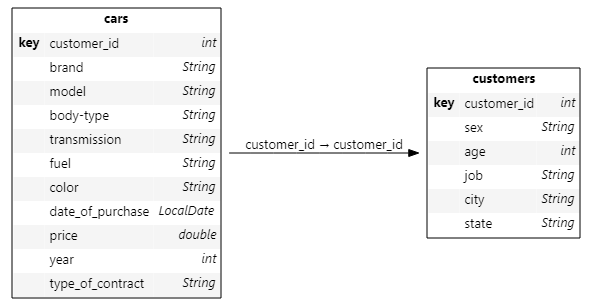
cust_store = session.read_csv(
"s3://data.Atoti.io/notebooks/sales-cube/cust_info.csv",
keys=["customer_id"],
table_name="customers",
)
cars = session.read_csv(
"s3://data.Atoti.io/notebooks/sales-cube/cars_us.csv",
keys=["customer_id"],
table_name="cars",
types={"price": tt.type.DOUBLE},
)
cars.join(cust_store)
cube = session.create_cube(cars, name="cars")
With the above snippet, we have just created a multidimensional data cube with two tables, along with a web application for dashboarding.
Creating visualizations
In case you’re wondering if we have to learn MDX, no. We don’t. We can easily create a visualization with a single line of code and some drag and drop as demonstrated below.
Formulating KPIs
Atoti automatically creates some measures for the numerical columns to kickstart our data exploration. We can also create our own KPIs. So in the case of retail, we can easily compute the margin as follows:
cube.measures["SellingPrice.VALUE"] = tt.value(selling_prices_table["SellingPrice"])
cube.measures["PurchasePrice.VALUE"] = tt.value(purchase_prices_table["PurchasePrice"])
cube.measures["num_purchase"] = tt.value(classified_products_table["n_purchases"])

cube.measures["Margin.SUM"] = tt.agg.sum(
    (cube.measures["SellingPrice.VALUE"] - cube.measures["PurchasePrice.VALUE"]) * cube.measures["num_purchase"],
    scope=tt.scope.origin(cube.levels["ProductId"]),
)
A great thing about creating measures in a multidimensional cube is that we can drill-in to any dimensions and it will be computed on the fly for us.
Now, we can explain our data with a pivot table and show the underlying formulas alongside the table.
Presenting insights to business users
Instead of creating a slide deck all over again for business users, why not just publish the visualizations that we have created for the technical users to the Atoti web application?
We can then easily build and present an interactive dashboard to the business users:
The good thing about having an interactive dashboard on Atoti is that we can always put together new widgets on the fly using the same intuitive drag and drop experience to answer any impromptu questions from the business.
There you go: an easy and interactive way for technical and business peers to collaborate! Have fun with your next presentation.


