

Faced with creating an NLP text to query exploration of storm data from a spider dataset requiring multidimensional analysis and storytelling through visuals, Tasneem and her team discovered Atoti.

“I didn’t need to switch from different tools to construct the cube and then switch to another tool to create a visualization. I was able to do everything in the same Jupyter notebook just using Atoti.”
Tasneem Ahmed
Tasneem is a budding Data Scientist who discovered Atoti during her graduate studies. Her exploration into the library allowed her to create a cube and visualize it in one Jupyter notebook instance. Read on for her experience.
Hetal: How did you discover Atoti?
Tasneem: I discovered Atoti through my graduation project. My team was searching for a tool which handled multidimensional analysis, constructing a means and to perform visualizations in the same tool; and I found it.
Hetal: Why did you choose Atoti?
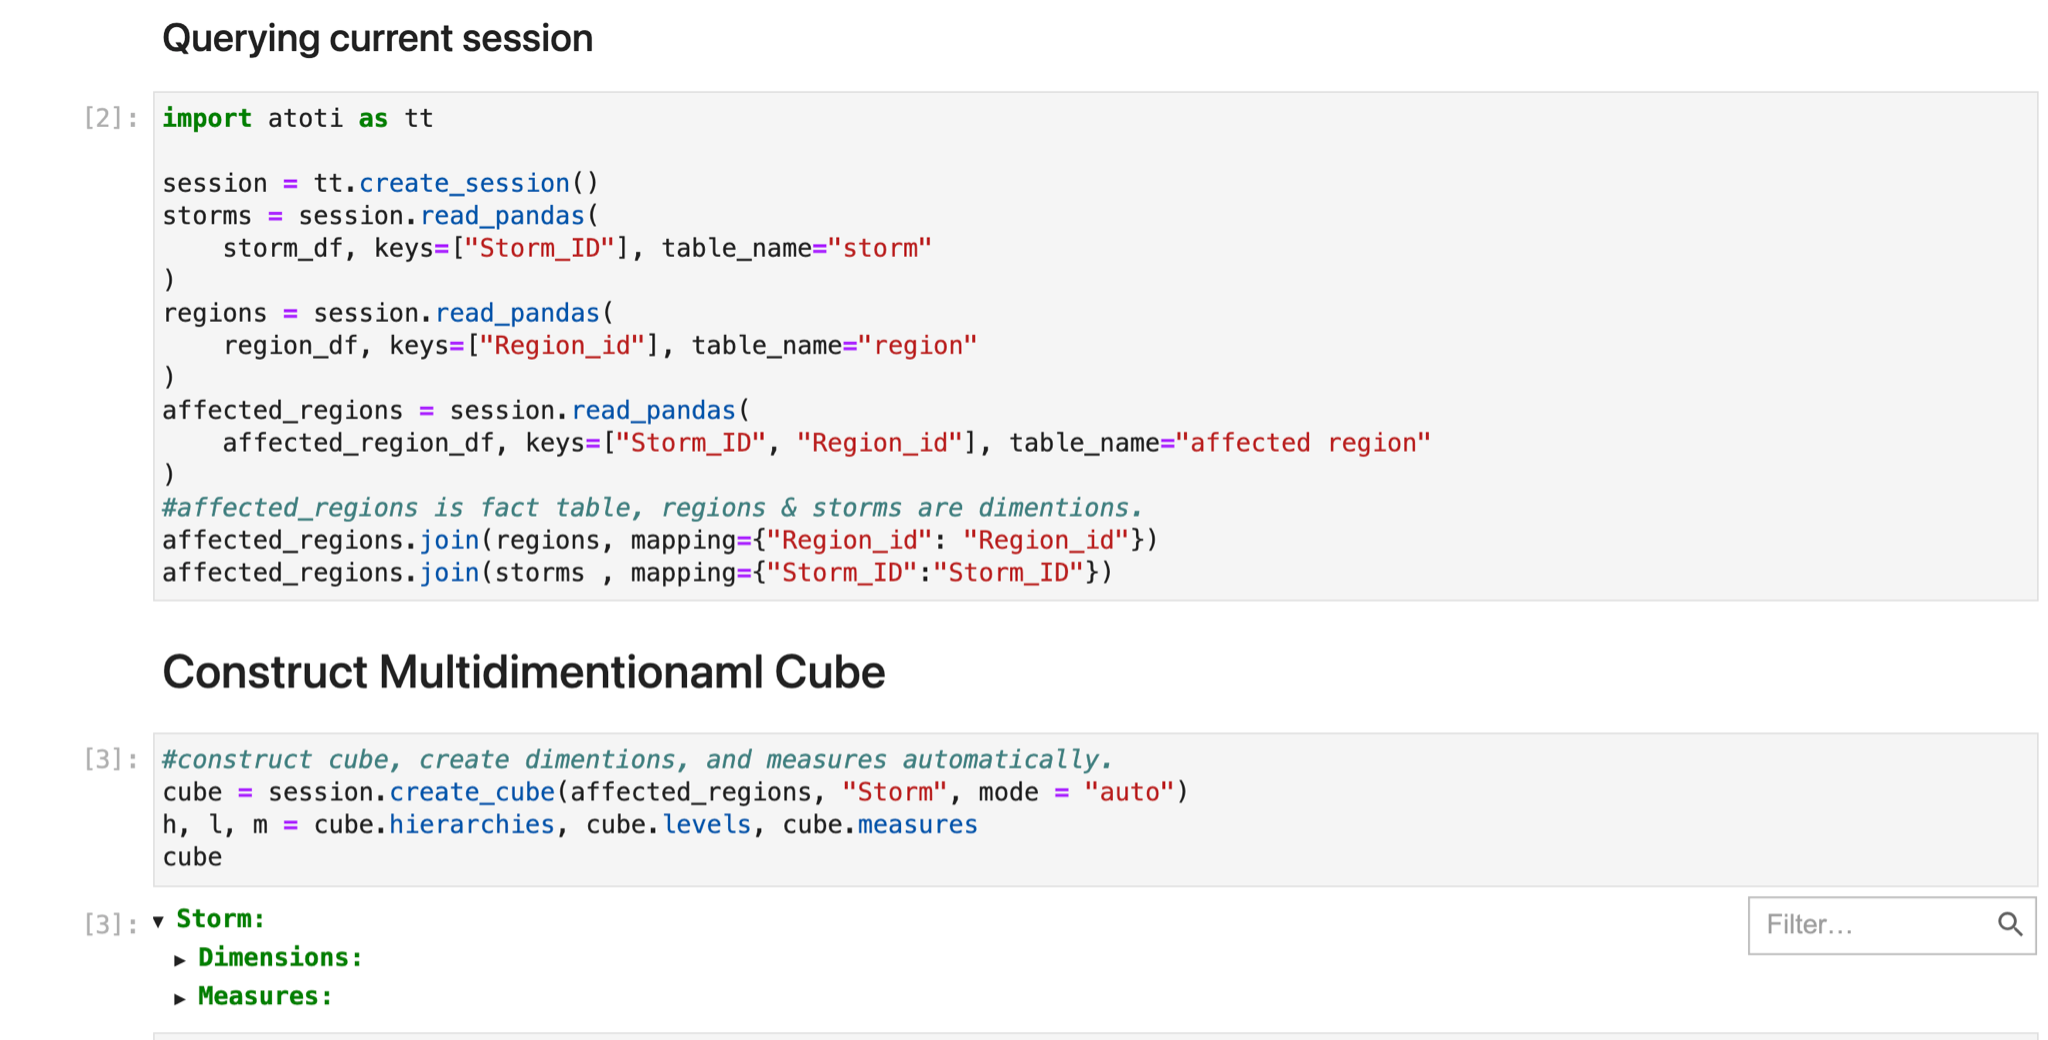
Tasneem: Cube creation was a built-in function of the library and it allowed me to create visualizations in the same notebook.
Hetal: Which Atoti feature did you find most useful in your work?
Tasneem: I think the reason why I most wanted to use Atoti is to leverage its ability to build a cube and to automatically create measures and hierarchy measures and dimensions then use that to make visualizations and dashboards with one line. I deployed my project into an AWS service like Amazon EC2 and ECS.
Hetal: Have you previously worked with any other data analysis tools?
Tasneem: Yes, I previously worked with python, R, and Power BI to create visualizations; SQL Server integration service to make ETL; and SQL Server analysis service to build the cube. But I found most of these features in Atoti: extracting the data, constructing the cube and the visualizations. I didn’t need to switch from different tools to construct the cube and then switch to another tool to create a visualization. I was able to do everything in the same Jupyter notebook just using Atoti.
Hetal: What would you say to someone who’s just starting out using Atoti? What advice would you give them?
Tasneem: I can say when you start learning Atoti, I recommend first watching tutorial videos under Atoti resources and going through the starter guide tutorial-it’s very good. You can see many features and from there, dive into the features you want to build in your notebook.
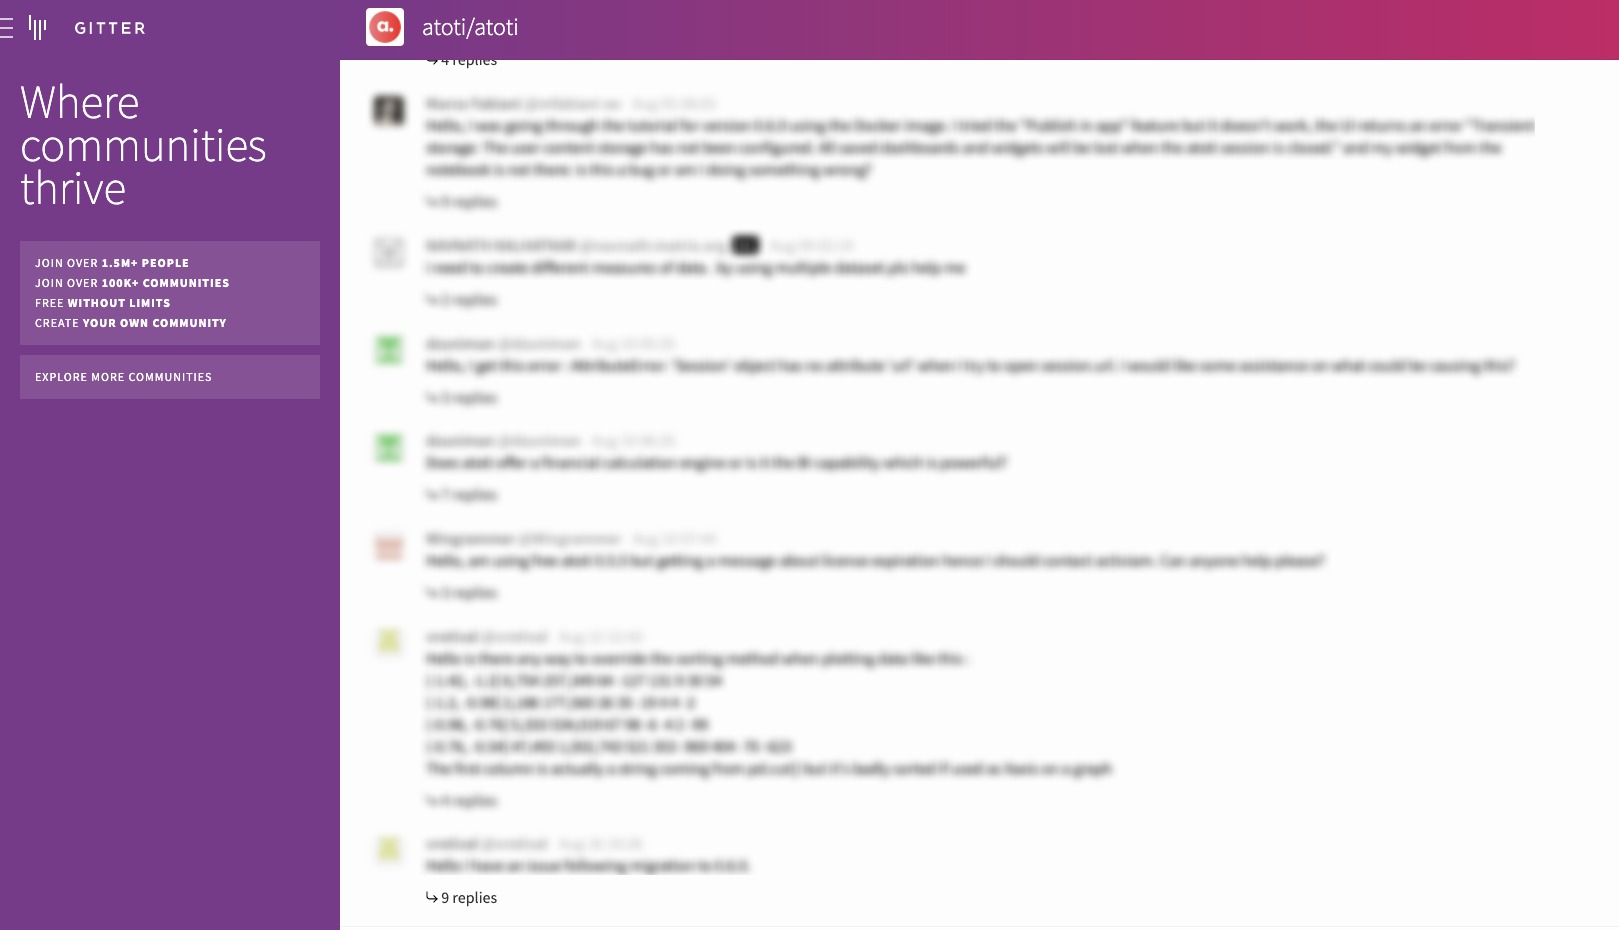
Hetal: Did you also use Gitter or our Ask the community questions?
Tasneem: When I was working on my project I found it was very good at answering my questions: I would get a quick answer within a day. The community is good.
Hetal: Thank you so much for that! Could you go through your specific notebook that you did on the weather predictions. Do you mind walking us through your notebook?
Tasneem: Yes, I can. This was for my graduation project. We had many different domain options in spider data sets and we chose a specific domain: storm record.
First we extracted storm record data-since it was a Spider data set, it had multiple tables covering 138 different domains in English, contained in two formats: JSON and SQLite. We chose SQLite to make it easier to use. It consisted of 10,000 and more questions and complex SQL query. But we could see the use of storm records analysis and building cube from this data set and create visualizations.

Hetal: And what were you trying to study in your storm data?
Tasneem: We didn’t specifically study the storm record data, we chose it at random. From the spider data set the goal was to get the user to ask a question and get an answer. It was more semantic language processing: convert the natural language question to an MDX query.
Hetal: What made you choose this data set?
Tasneem: It was interesting data, but we didn’t need any specific data; we needed to apply a specific concept semantic parsing, of converting natural language on specific data to a chart.
Hetal: Even though this project was a part of your graduation project, you applied a lot of passion to it. What made it important to you?
Tasneem: It was important because it was my graduation project for my last year, and I love this, like real data analysis or data science! I was inspired because you can use it to help make decisions for a company. And, you can apply the concept to any industry to help make decisions.
Hetal: Do you have a preference in your data science work between say, natural language processing or other topics?
Tasneem: I think the best part is the analysis and generating statistics from it. Then from the analysis, generating the visualizations and doing some of the data cleansing.
Hetal: Oh! So you really like the data analysis cleansing part as well as the story telling part!
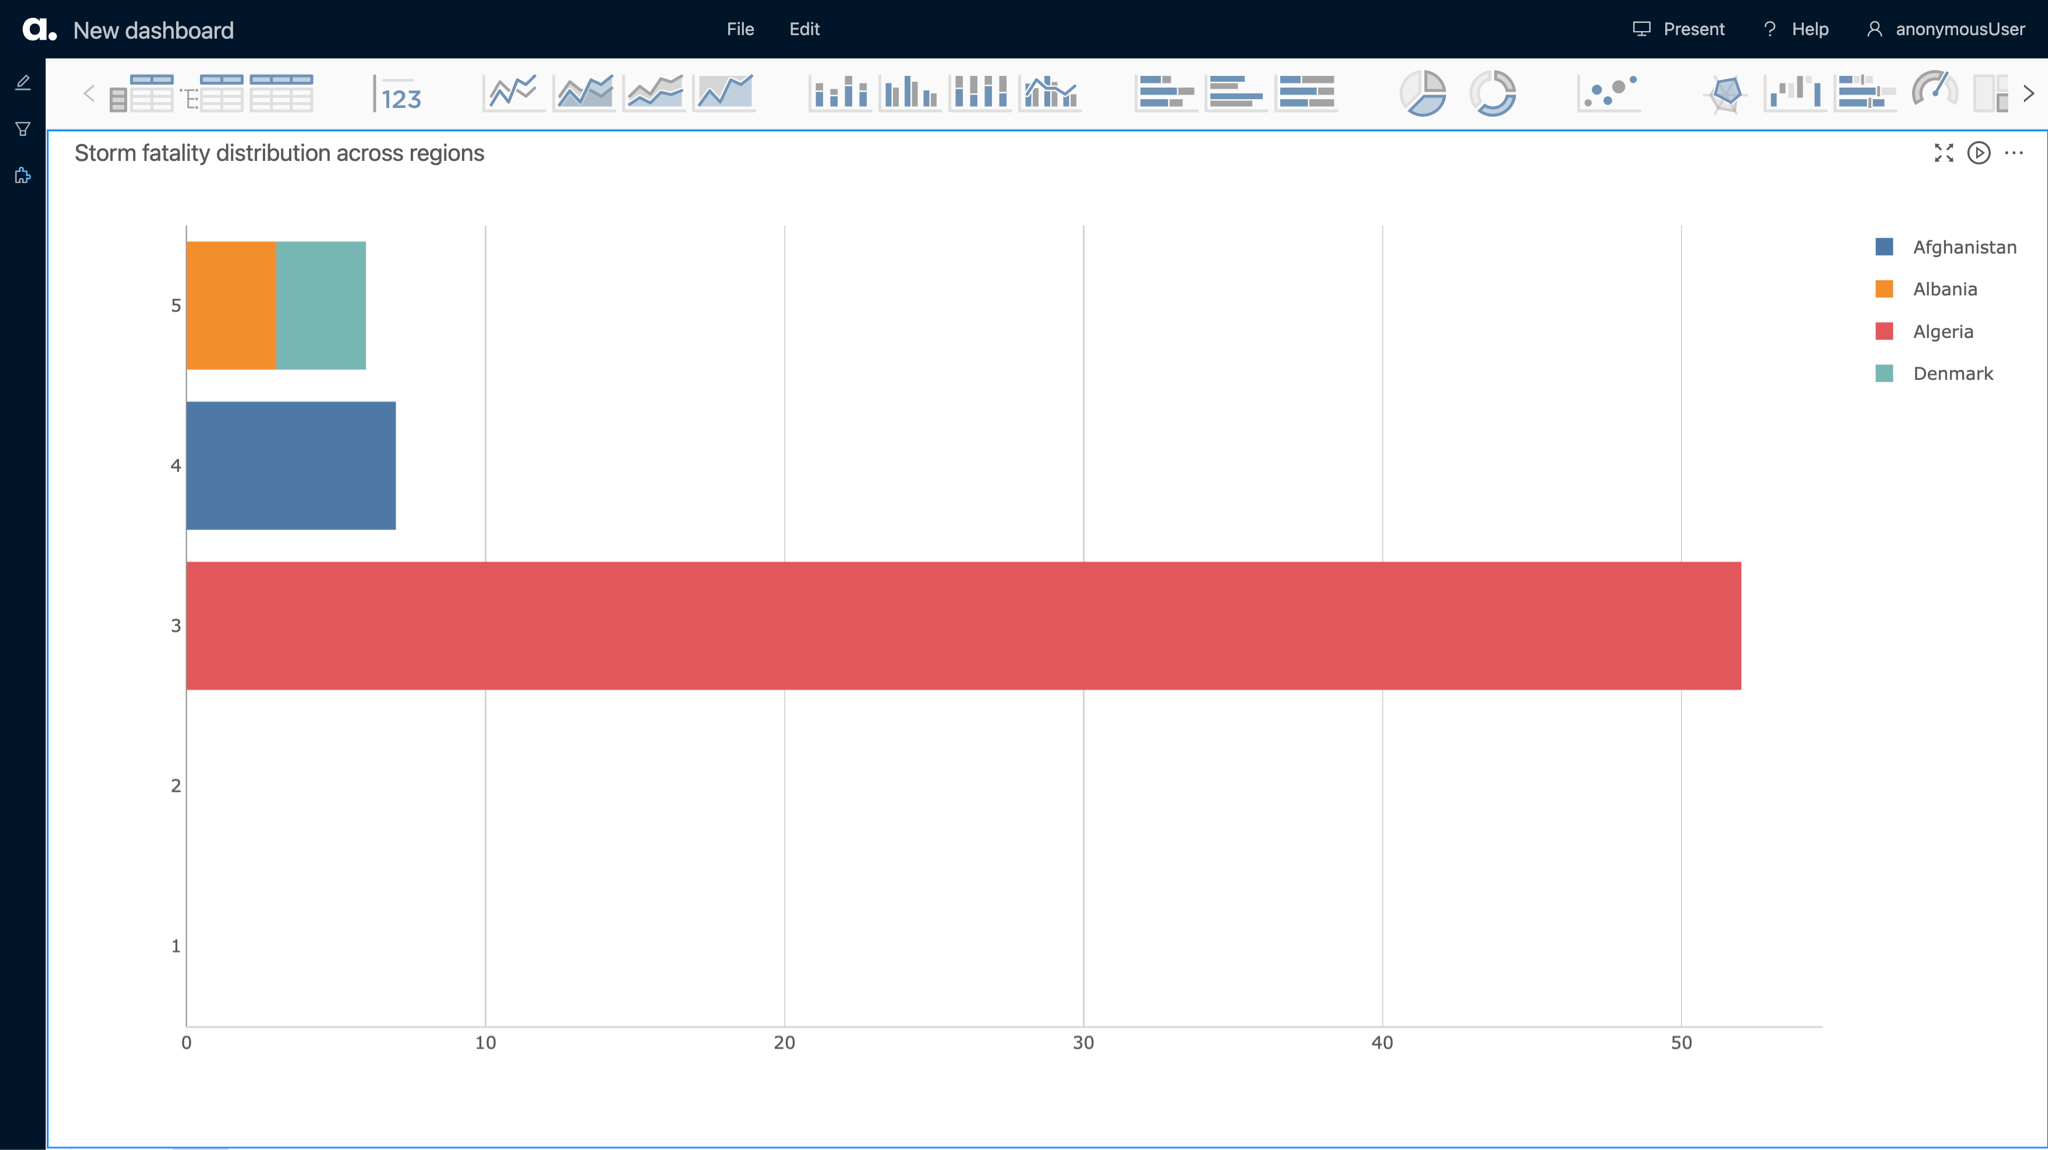
Tasneem: Yes. For my project I used session.url [note-in the latest version, you can use session.link()] to get the dashboard link and send it as a BI user interface where the manager could go and create his or her own charts in the dashboard.
Hetal: Did you create a few visuals in advance for the dashboard?
Tasneem: I played with the charts: pie charts, bar charts, lines and others;but I wanted the user to create his or her own charts and dashboards.
Hetal: So you were really using the collaborative part: “I provide the data, you can visualize it”. Do you have any plans to expand this project going forward?
Tasneem: I think yes, I want to try the new version of Atoti and figure out how to link it with the user interface. It would be nice to get a manager’s authorization to use this. When I was searching for a suitable tool, Atoti was the best way to solve my problems in production.
A hearty thank you to Tasneem for taking the time to talk to us. To further explore her Jupyter notebook, be sure to visit her github page.
For more examples of ways to use Atoti, please be sure to check out our notebook gallery, and follow us for more stories like this!


