

A clear understanding of your daily liquidity, so you know your daily reserves requirements
With BCBS 248, the Basel Committee on Banking Supervision outlined a clear set of reporting criteria for monitoring daily liquidity, leading to a better understanding of the required capital needed on hand. Understanding payment flow is critical for determining this, especially given the trend towards real time cash flows like real time gross settlements. It is clear intraday liquidity is such an important topic for a company’s comptroller.
But intraday liquidity extends beyond the Treasury department. It matters for the trader who needs to monitor the movement of their client’s accounts. Or for those working in capital optimization trying to assess risk. It matters for those who are working on regulatory compliance initiatives like adherence to BCBS 248 or the US’s Federal Reserve’s Payment System Risk Policy on Intraday Credit. And, of course, for the collateral management team who need to mitigate risk in unsecured financial transactions. With intraday liquidity being so important to so many teams, a bank would ideally build out one system to tackle all of its intraday liquidity related concerns–something that is possible to do with Atoti.
How do you monitor your liquidity?
Background
We explore monitoring intraday liquidity using Atoti CE, demonstrating how to understand your cash flow, not only allowing you to meet your reporting requirements but to better understand your liquid asset needs.

As many of the world’s Central Banks move to real time gross settlements, a bank’s daily cash flow tracking has become far more complicated. Add to this mix complications like intraday margin calls (anyone else remember the wave of margin calls during the Brexit vote results???), stress events like counterparty defaults, and cross currency transactions (do you have the cash in the right currency?), suddenly it is clear that liquidity is more than just simply keeping a time based ledger.
Here, we built out an intraday monitoring system using Atoti CE. Using simulated payment data, we demonstrate how we can keep track of payments and their directions, capable of easily answering questions like:
- What is the gross total payment sent or received in a day?
- What are the top three ingoing and outgoing payment amounts?
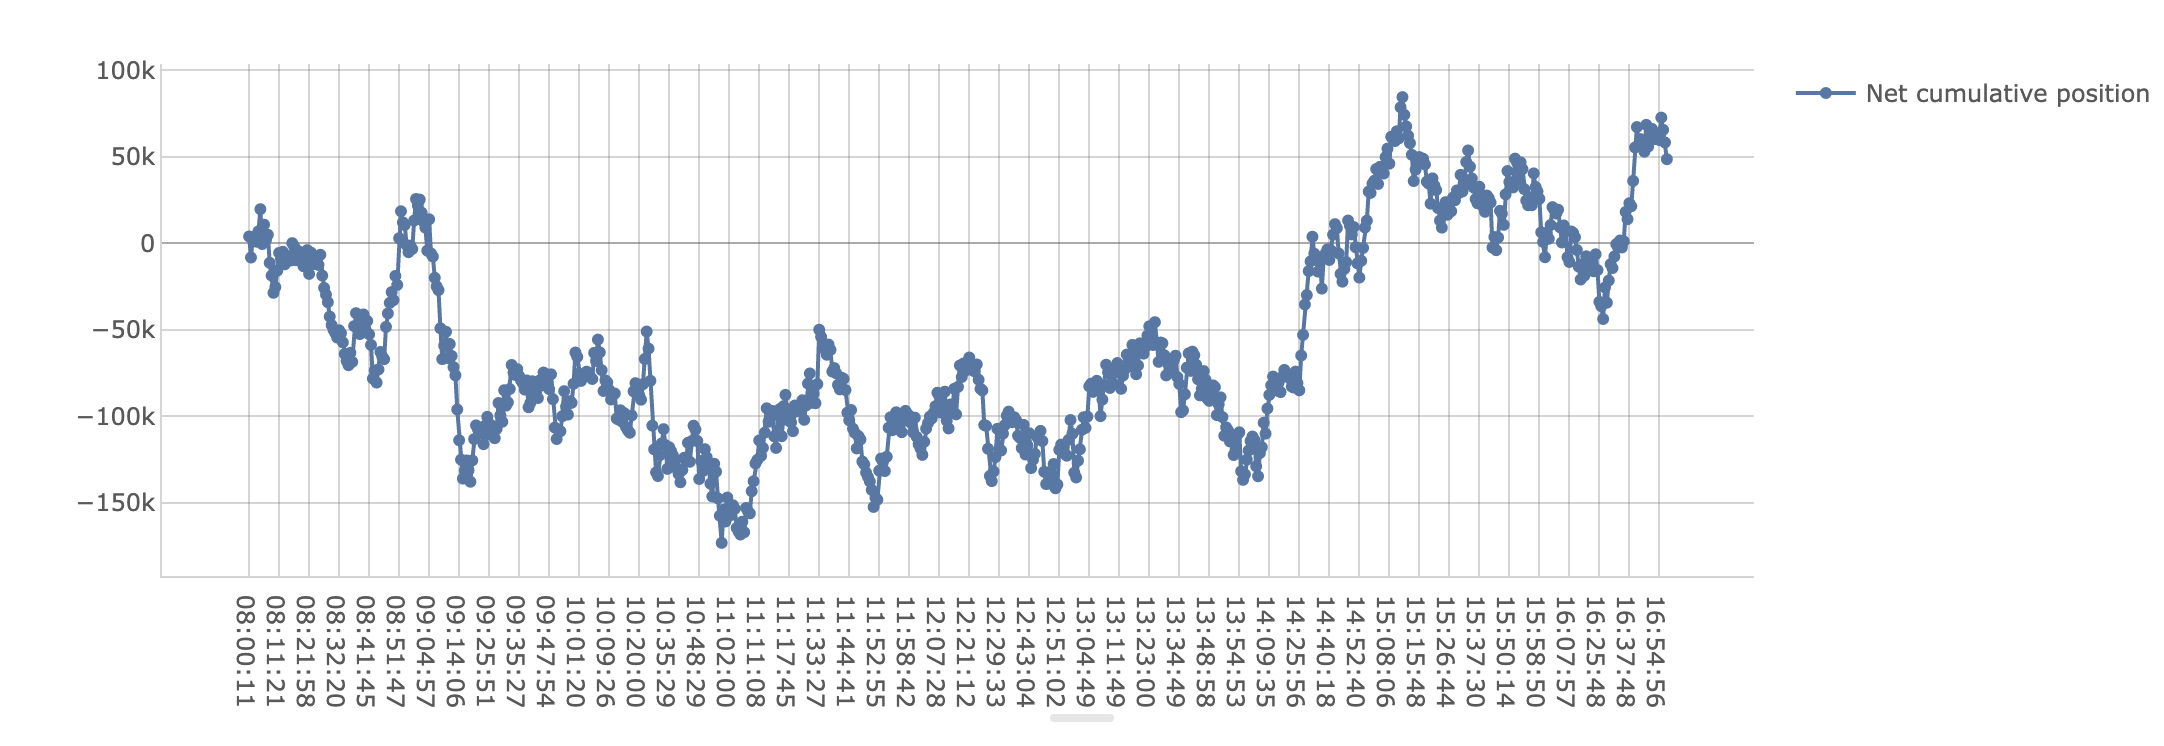
- When do we experience the highest and lowest liquidity?
These questions and more are at the heart of BCBS 248, the Basel Committee on Banking Supervision’s framework for Intraday Liquidity Management.
Setup
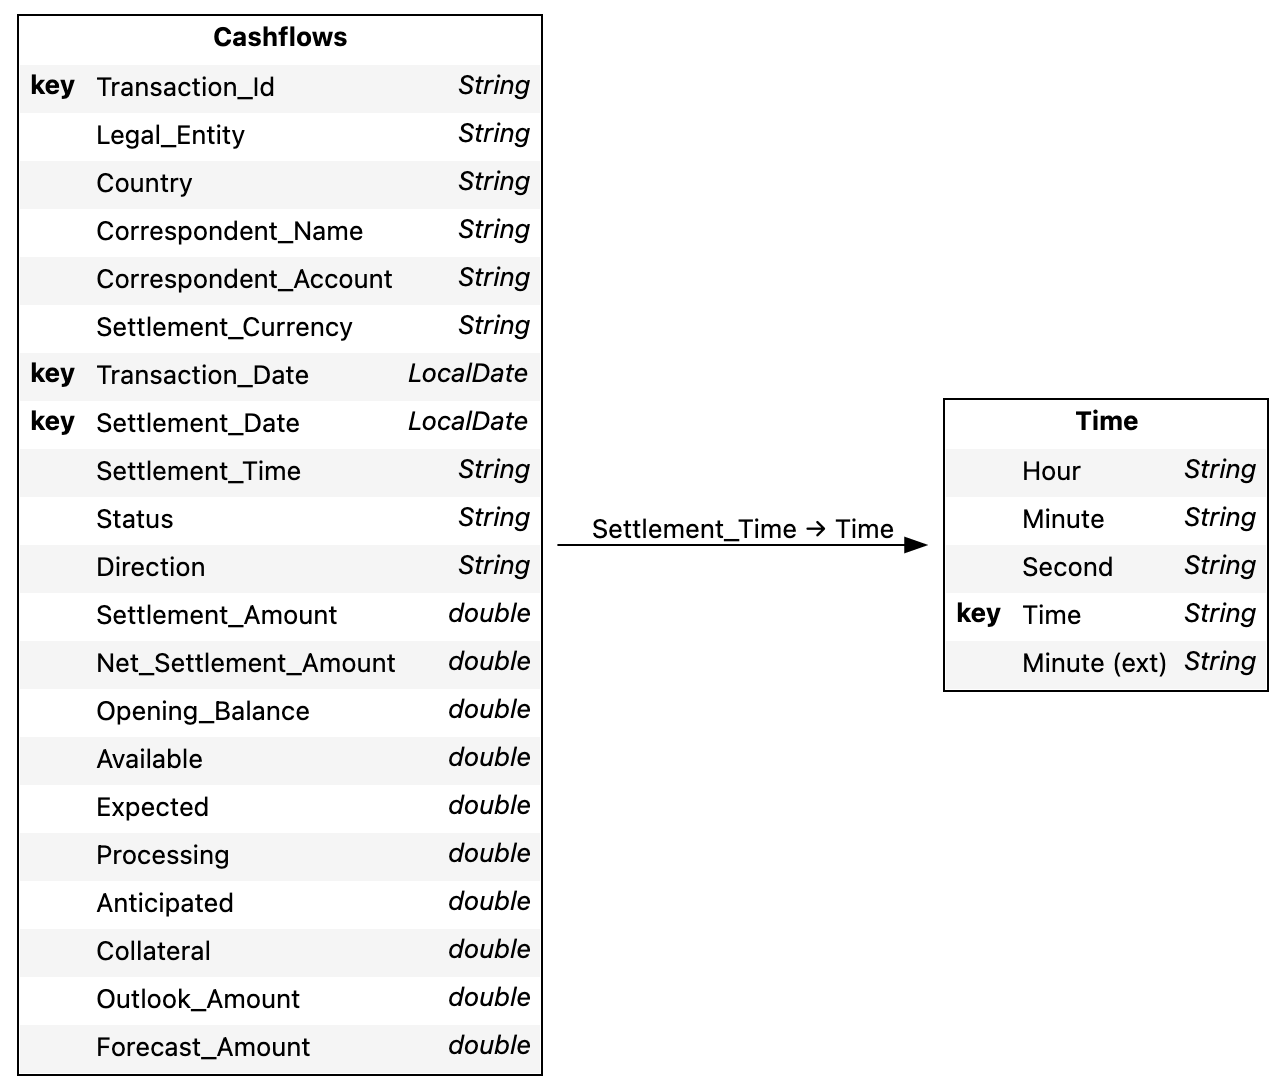
To begin our exploration, we’ve created simulated transactions experienced by a bank for September of 2021. Each transaction record details the:
- legal entity
- country
- correspondent account
- payment directionality
- settled amount
- settled time and date
- transaction currency
and much more.
Knowing the precise minute for each transaction is imperative, as part of BCBS 248 requires reporting the max three net positive and net negative cumulative positions. Thus, the order of each transaction matters.
We compute our key metrics required by BCBS 248 sing the transactions data.
Basic metrics
The originating data contains several amounts in each record, a direction of flow (in versus out), and each transaction could be in a distinct currency. Accurately capturing the running total based on these amounts requires treating the currency and directions correctly.
To start with, we create basic metrics for each numerical column where we have currency data. This ensures we only total data where we know how it should be treated: anything without a currency should be investigated.
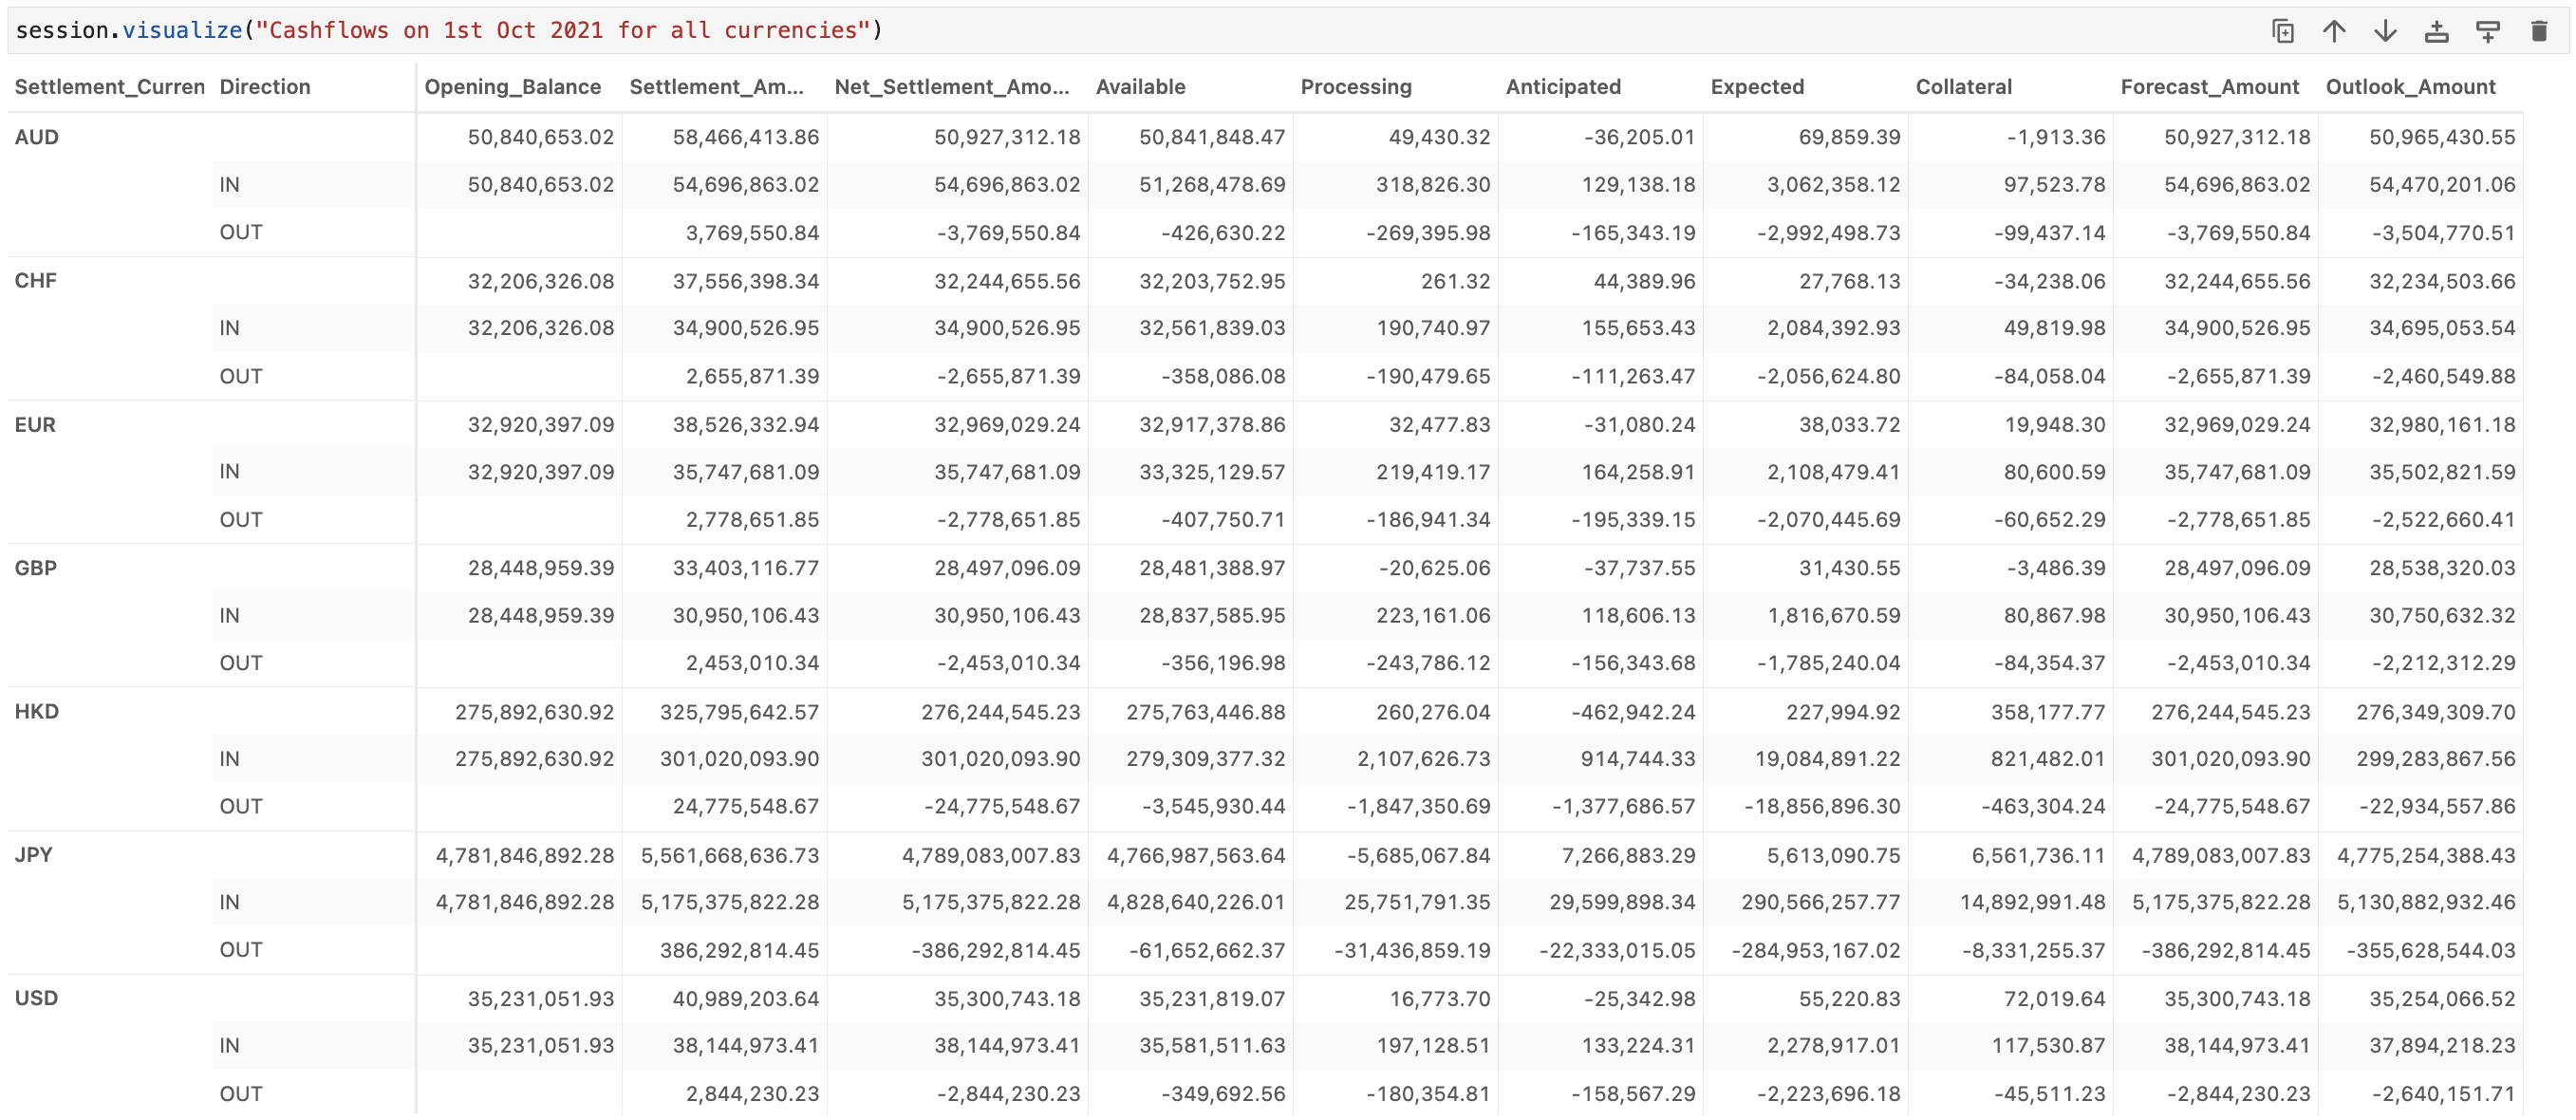
From here, it is also straightforward to compute the gross payment sent and received, using Direction to filter for outbound transactions for gross payment sent, and Direction and status for inbound payments. Using status is critical for inbound payments as it prevents counting cash that is still pending receipt.
With the building blocks set, we can move towards constructing metrics related to reporting requirements.
Max and min metrics
Understanding liquidity needs requires understanding what is generally speaking the best and and the worst position we can expect to find ourselves. This is handled by considering on a given day what is the max cumulative positive set of transactions (best position-we are flush with cash on hand) and what is the max negative cumulative position (our “worst” position-we are due to send out quite a bit of cash).
To ensure we are effectively handling outliers, the BCBS requirement asks for the three such highs and lows, and the computed average of these.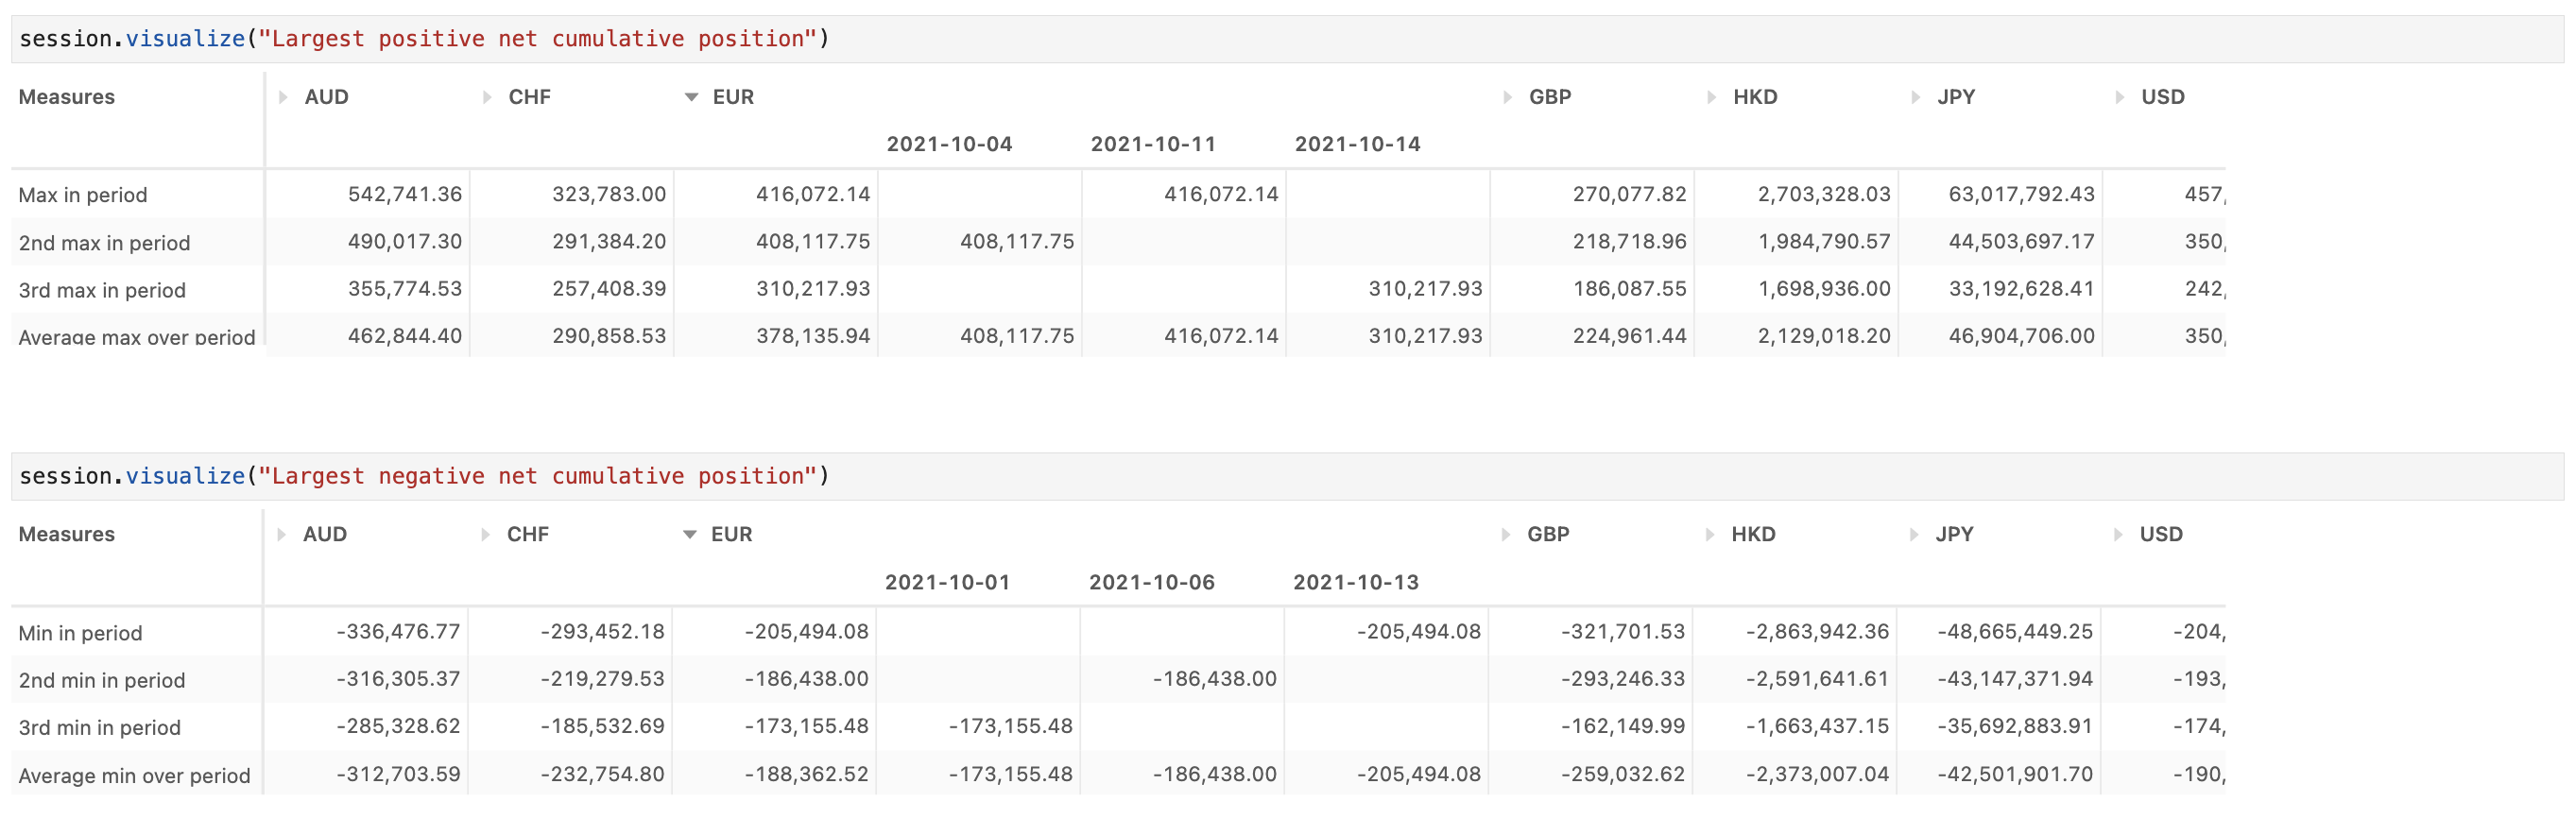
Value Added
With Atoti CE and real time integration, tracking the movement of cash is easy to monitor. Leveraging Atoti’s on the fly aggregations, each measure dynamically updates as the data is ingested. It allows us to see in real time how our current balance, available balance and forecast amount evolves.
Curious about this use case? Reach out to us to see this use case in action, or contact ActiveViam for a demo.
Curious what this would mean if everything were converted to a single currency? Check out our article explaining how we can implement currency conversion here.

