

Streaming and monitoring the most granular risk data
UPDATE: The GIFs and code snippets in this article are based on versions prior to Atoti 0.7.0. They may have evolved or become obsolete. Check out the Atoti documentation for the latest features.
The finance industry works by constantly evaluating the risks associated with positions and trades. This is necessary for companies to conduct their business and maximize their profit, but also because public regulators make it a requirement for banks and other institutions to stay within certain margins of risk – and be able to demonstrate that they do so consistently. This is a challenge because risk calculations are fairly complex, they must be applied to billions of new transactions every day and they must be completed quickly enough to keep business going smoothly.
Over the last years, trading and risk technology has dramatically improved. Risk engines are now capable of calculating risk numbers on-the-fly, however, most of the business processes are still relying on overnight calculations, not achieving true real-time risk, despite significant business benefits. The extreme market volatility during Covid-19 made it particularly important to monitor risk closely in order to keep business safely afloat and take advantage of investment opportunities that arise.
With new technology and computational methods such as Algorithmic Adjoint Differentiation (AAD) we can compute risks and attributed profit and loss (P&L) faster, for a wide variety of products and at a higher granularity. But this is just a first step on a road to real-time risk management. We need a decent tool for real-time analytics and in this post, I’d like to walk you through the process of creating a notebook for an in-memory analytical app that can incrementally update and (re) aggregate large volumes of trade level risk data reflecting real-time market data updates.
In our example, we will create a real-time risk dashboard using the Atoti python module showing various sensitivities for an equity options portfolio. We are going to simulate a live feed of market data and use QuantLib to recalculate sensitivities on the fly, stream updated risk numbers to an Atoti-powered in-memory cube which will update our risk dashboard. All with a few dozens of lines of python code! Sounds interesting? Bear with me.
From real-time market data to real-time risk
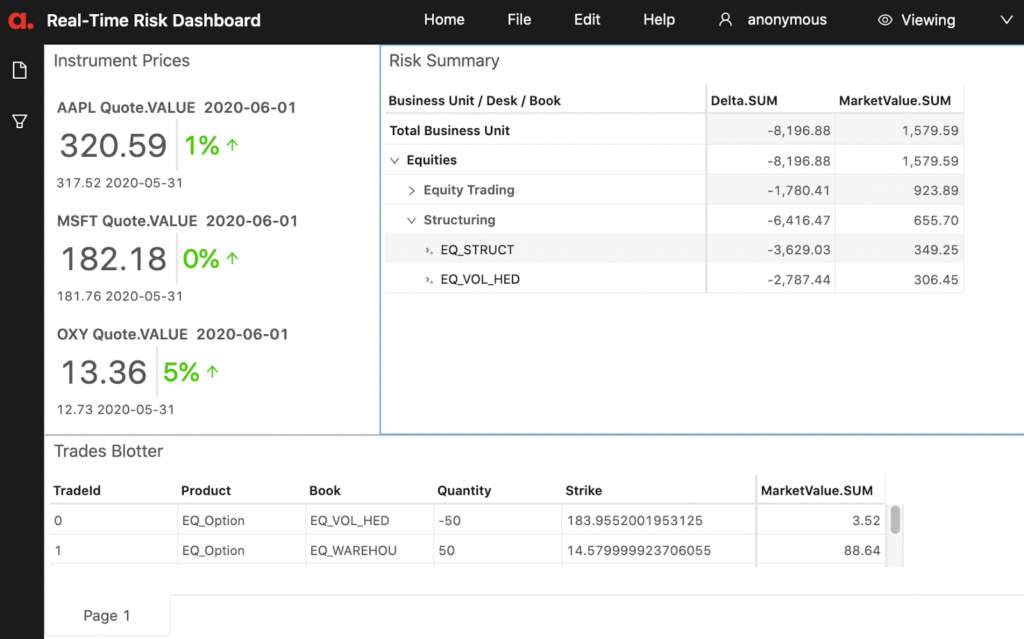
Have a look at the running Atoti application below. On the left, we have a real-time market data feed which is a replay of historical stock prices. On the bottom, there are our trades and on the right, we have risk data continuously re-calculated and re-aggregated at various levels. Every time market data is updated, a chain of actions is performed automatically resulting in an update to a risk summary. With this in mind, let’s dive deep into the details!

Market data updates and risk calculation
We are going to use QuantLib to compute per-trade sensitivities for an option portfolio. Having stock prices and trade details, QuantLib helps us to get sensitivities (risk) numbers.
To simulate the market data updates, I am going to replay simulated stock tick prices. This code snippet downloads historical data and pushes new tick updates into a queue:
import queue
import threading

should_publish = threading.Event()

spot_update_queue = queue.Queue()
tick_data = pd.read_csv(
    "stock_price_tick_data.csv", index_col="AsOfDate", parse_dates=["AsOfDate"]
)

def start_spot_publisher():
    # The publisher is replaying tick_data.
    # It waits for the should publish event (see subsequent cells to trigger).

    current_time = -1
    for idx, row in tick_data.iterrows():
        next_time = idx
        if current_time != -1:
            dt = (next_time - current_time).total_seconds() / 100.0
            time.sleep(dt)
        current_time = idx
        print("\rawaiting for publishing update " + str(idx), end="")
        should_publish.wait()
        print("\rpublishing update " + str(idx), end="")
        spot_update_queue.put((idx, row.to_dict()))
    spot_update_queue.join()
    print("All work completed")
Now let’s connect our risk calculation function to the queue to get real-time risk updates:
def start_spot_update_listener():
    print("Real time updates started")
    while True:
        calc_date, spot_prices_by_ticker = spot_update_queue.get()

        """
        As discussed above, I'm illustrating the "reactive" data store
        by configuring it with the parameter watch set to True.
        With the following code I'm updating the file on disc:
        """
        reprice_portfolio(spot_prices_by_ticker, positions, calc_date).to_csv(
            "risk_data.csv", index=False
        )

        """
        The second example of real-time implementation - is injecting the data
        directly into a datastore.
        With the following code I'm appending the new stock prices to the market data store.
        """
        for i in list(spot_prices_by_ticker.items()):
            if not pd.isnull(i[1]):
                print((calc_date.strftime("%Y-%m-%d"), i[0], i[1]))
                market_data_store.append((calc_date.strftime("%Y-%m-%d"), i[0], i[1]))

        spot_update_queue.task_done()


listener_thread = threading.Thread(target=start_spot_update_listener, daemon=True)
publisher_thread = threading.Thread(target=start_spot_publisher, daemon=True)
To trigger the updates, I will run the following cell:
publisher_thread.start()
listener_thread.start()
# start publishing
should_publish.set()
And to pause the updates, the following command is used:
should_publish.clear()
Once we have all market data publishing and risk calculating bits in place, it’s time to build a risk dashboard. Let’s use Atoti to aggregate and visualize the calculated risk numbers.
Atoti
The first step is to import the Atoti module and create a session for an in-memory data cube:
import Atoti as tt
from Atoti.config import create_config

config = create_config(
    metadata_db="./metadata.db", max_memory="8G", sampling_mode=tt.sampling.FULL
)
session = tt.create_session(config=config)
Please refer to this article if you need more information on getting started with Atoti.
Real-time feeds in Atoti
As we discussed, we have two live feeds in our app – a market data feed simulating the tick stock price time-series which is then producing a feed of risk numbers by recalculating option greeks with a Quantlib function. You can easily replace them with your own real-time data sources – for example, live trade feeds, sensitivity updates, stress-testing numbers, etc.
Atoti provides several methods for the real-time update: the first is by using the reactive datastores – it tells Atoti to watch a file or a folder and fetch updates as soon as there are any, the second is the “append” command that pushes new data into a data store forcing re-calculation, the third is subscribing to a message bus, such as a Kafka feed – see the load_kafka method below.
Monitoring file updates
I’m creating the sensitivity_store and connect it to a source, in my case a csv file on disc, by setting the parameter “watch” to True:
sensitivities_store = session.read_csv(
    "risk_data.csv",
    keys=["AsOfDate", "TradeId", "RiskFactor"],
    store_name="Sensitivities",
    types={"TradeId": tt.types.STRING, "AsOfDate": tt.types.LOCAL_DATE},
    watch=True,
)
The parameter “watch = True” makes the sensitivities_store fetch the updates from the file on the disk automatically when it changes. The parameter “watch” is available for read_csv and read_parquet functions, as described in the Atoti doc.
Please note that it will append/update the records, i.e the rows with the same key will be overwritten, and the rows with the new keys will be appended. To remove the expired trades, I’d need to tag them as “terminated” – read about static data later in this post – and filter in the user interface. Alternatively, I would need to update their risk to 0.
Injecting records incrementally
To implement real-time instrument prices, I’ll be pushing new values using the datastore append command.
As a first step, I’m creating the market_data_store. As you probably noticed, I’m not setting the “watch” parameter as in the previous example, as it defaults to False:
market_data_store = session.read_csv(
    "market_data.csv",
    keys=["AsOfDate", "Instrument"],
    store_name="Market Data Store",
    types={
        "AsOfDate": tt.types.LOCAL_DATE,
        "Instrument": tt.types.STRING,
        "Quote": tt.types.DOUBLE,
    },
)
At any time, I can use the append command to inject new records, for example:
market_data_store.append(("2020-05-01", "AAPL", 310.0))In my example, I’m simulating market data updates by replaying tick prices, putting them in a queue and pushing them into the cube.
Similarly, I could use the same append command for publishing sensitivity updates incrementally by trade and risk factor – the choice depends on your data flow.
Having market data and sensitivities in a cube, you could compute greek-based P&L in real-time mode! But I leave that for a future post.
Kafka feed and a custom deserializer
Now let’s have a quick look at enabling a kafka feed for datastore.
I’m using Bitnami Docker Image for Kafka to run kafka, as a first step I’m downloading the .yml:
curl -sSL https://raw.githubusercontent.com/bitnami/bitnami-docker-kafka/master/docker-compose.yml > docker-compose.yml
Then I’m adding the following parameter to the kafka environment section in the docker-compose.yaml – this makes Kafka accessible from outside the container.
KAFKA_ADVERTISED_LISTENERS=PLAINTEXT://127.0.0.1:9092
Then I’m using docker-compose to launch kafka:
docker-compose up -d
And then creating a topic for trades:
docker exec -it real-time-risk_kafka_1 /opt/bitnami/kafka/bin/kafka-topics.sh --create --bootstrap-server 127.0.0.1:9092 --topic trades
Let’s point the trades_datastore to the kafka feed. Atoti will consume the arriving trades data, and the widgets will refresh automatically (need to toggle them to real-time mode though – see below in the “real-time dashboards” section).For a complete list of the Atoti’s load_kafka parameters, please refer to the doc load_kafka. In this example, I will leave the defaults for the batch_duration and consumer_config and create a custom serializer – that will skip certain fields from the trade tickets.
# This serializer will pick up market value from the trade message. It also populates RiskFactor from the Ticker field:
def fetch_sensitivities(record: str):
    obj = json.loads(record)
    fact = {}
    for column in sensitivities_store.columns:
        fact[column] = obj[column] if column in obj.keys() else ""
    fact['RiskFactor'] = obj['Ticker']
    return fact
I’ll be using python kafka module to push new trade events. In the next cell, I’m sending a first trade message.
# Emulating a new trade message
import json
from kafka import KafkaProducer
producer = KafkaProducer(
    value_serializer=lambda v: json.dumps(v).encode("utf-8"),
    bootstrap_servers=["127.0.0.1:9092"],
)
# Test trade
trd = {
    "AsOfDate": "2020-07-09",
    "TradeId": "New_Trd_Test",
    "Ticker": "OXY",
    "Book": "EQ_VOL_HED",
    "Product": "EQ_Option",
    "Quantity": 45,
    "Strike": -31.41249430583221,
    "Maturity": "2022-10-01",
    "OptionType": "put",
    "MarketValue": 89.43425919208067
}

l = producer.send("trades", trd)
To see the messages, the following command can be run:
docker exec -it real-time-risk_kafka_1 /opt/bitnami/kafka/bin/kafka-console-consumer.sh --bootstrap-server localhost:9092 --topic trades --from-beginning
I’m generating random trades and publishing them into the “trades” topic – we can view them in the real-time dashboard (see the next section).
for i in range(10):
    new_trade = generate_a_new_trade(i)
    producer.send("trades", new_trade)
    print("Published.\n")
    time.sleep(1)
    clear_output(wait=True)
Real-time dashboards in Atoti
Data visualization in the Atoti app supports the “continuous queries” feature, enabling widgets to automatically refresh the results every time a single contribution changes in the data store.
You can create your own dashboards using the Atoti app. Start by running this code to obtain the URL:session.url
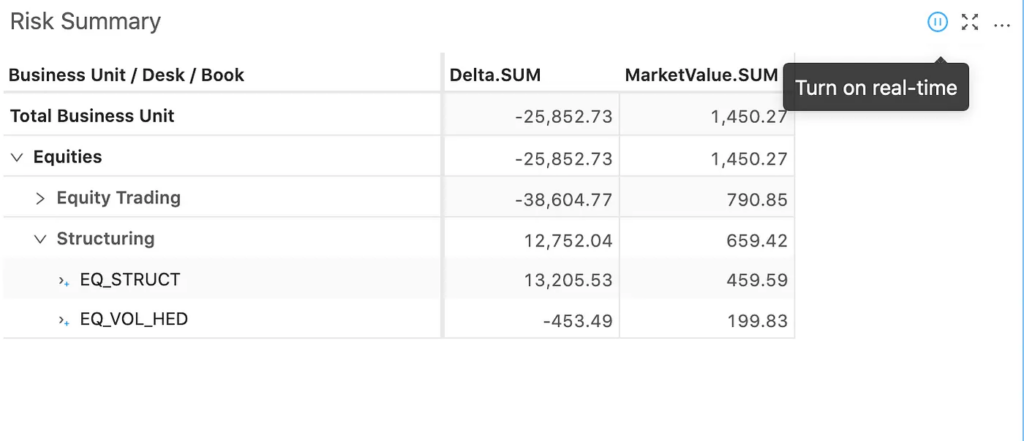
Now you can open the Atoti app and create dashboards. You can toggle between “Turn on real-time”, “Refresh periodically” and “Pause query” for each widget in the Atoti app:
Then, once we trigger our publishers, the dashboard cells will blink where data updates:
Static data
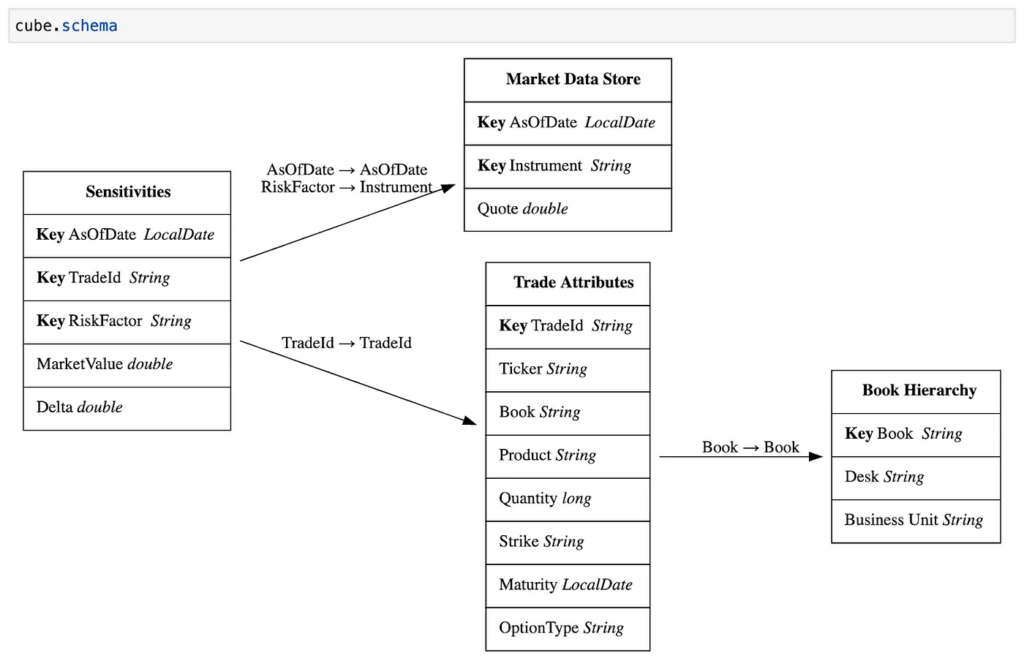
To facilitate the analysis, I can enrich the metrics with additional attributes such as risk factors, regions, sectors, trade typologies, etc. In my example, I’m adding trade attribute data and linking trades to a multi-level booking hierarchy.
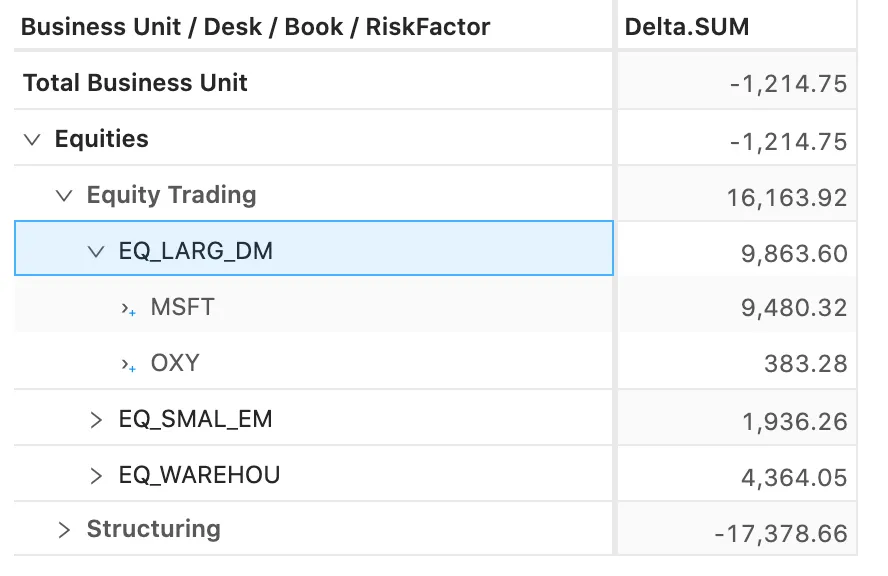
This enables to analyse the risk by expanding and collapsing the attributes:
In fact, the attributes do not have to be static. They can be refreshed as soon as data arrives. For example, by adding a “Trade status” into the Trade Attributes store I could use it to tag trades as “Terminated” and filter them out from the view.
What’s next?
Now that you know how Atoti and QuantLib can help you to process and visualize real-time data streams you are well equipped to build your own, more sophisticated analytical dashboards. In our next series, we will use this knowledge to build real-time VaR calculations, what-if analysis and many more. Stay tuned!
You can download the notebook I used for this post here: real-time risk in the Atoti gallery.

