Experience multi-dimensional data analytics with Atoti in Binder
I’m extremely excited to share how we can easily spin up a simple web application in Python with a few clicks! Before I go into the details, check out the following GIF:
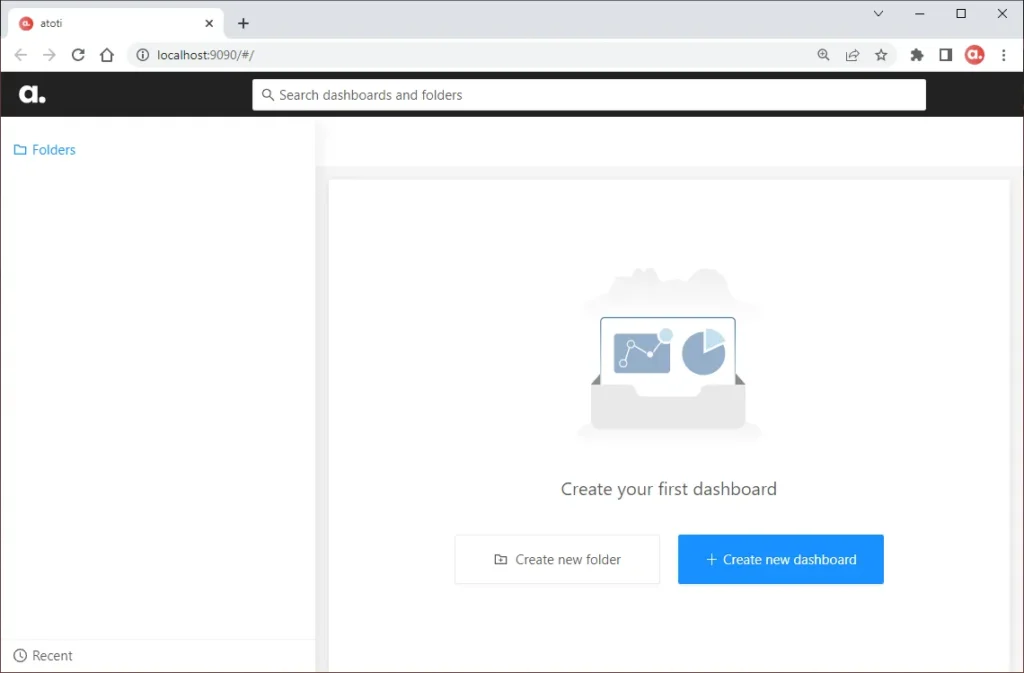
Get started
It is as simple as:
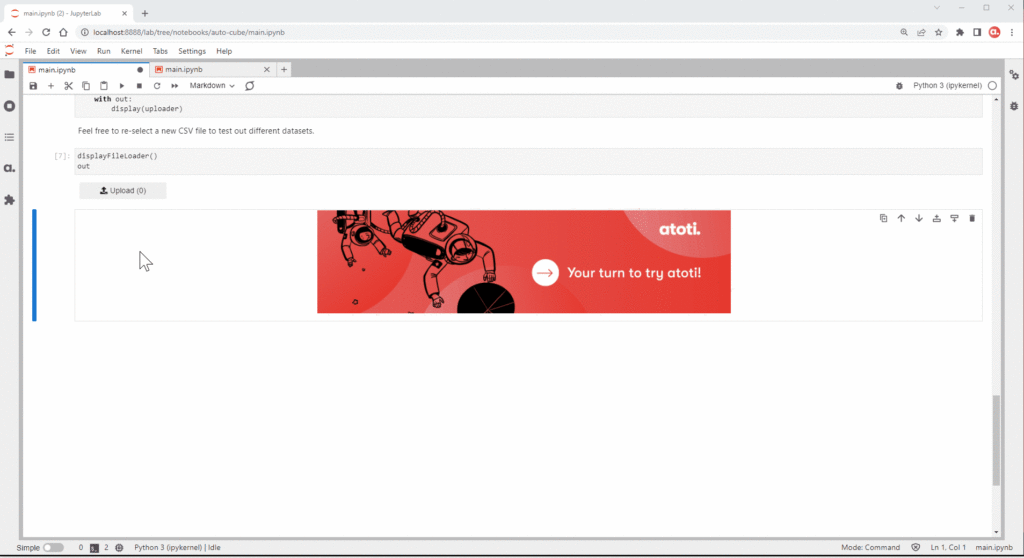
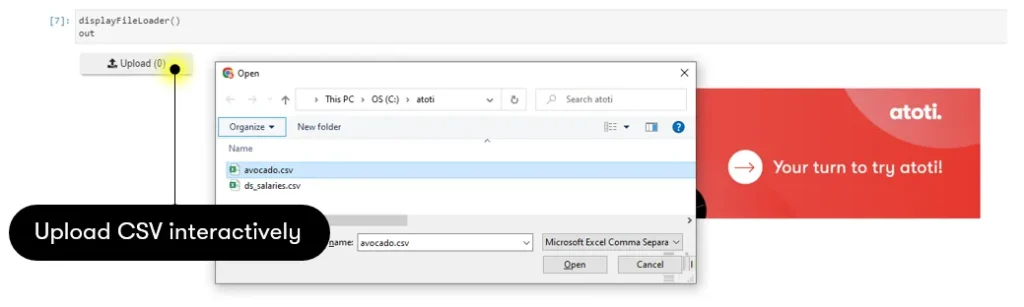
1. Uploading a CSV file
To better experience the benefit of multidimensional analytics, I would advise you to choose a dataset with a fair number of numeric and non-numeric columns, e.g. Data Science Job Salaries dataset from Kaggle. This is because of the default way Atoti handles data:
- non-numerical columns are translated into hierarchies
- a SUM and a MEAN measure will be automatically created for non-numeric columns (non-key columns)
2. Select keys that will give unique data rows (optional)
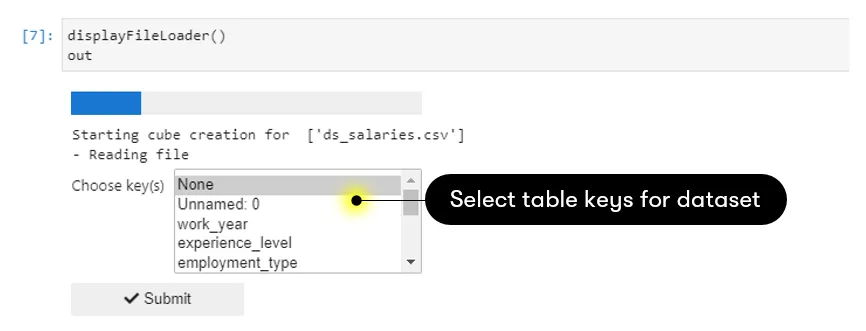
Applying keys to the table is akin to applying indices in an RDBMS database. Doing so helps to optimize the querying.
However, it is important to note that non-unique keys will result in a smaller dataset getting loaded. Only the last occurrence of the duplicates will be loaded into the cube. So if you’re unsure, leave the key(s) selection to “None”. In this case, the whole dataset will be loaded (unless you have duplicated rows ٩(͡๏̯͡๏)۶).
3. Launch the web application
If you’re running the notebook on your local machine, the program will automatically open up a browser tab with the application URL-https://localhost:9090.
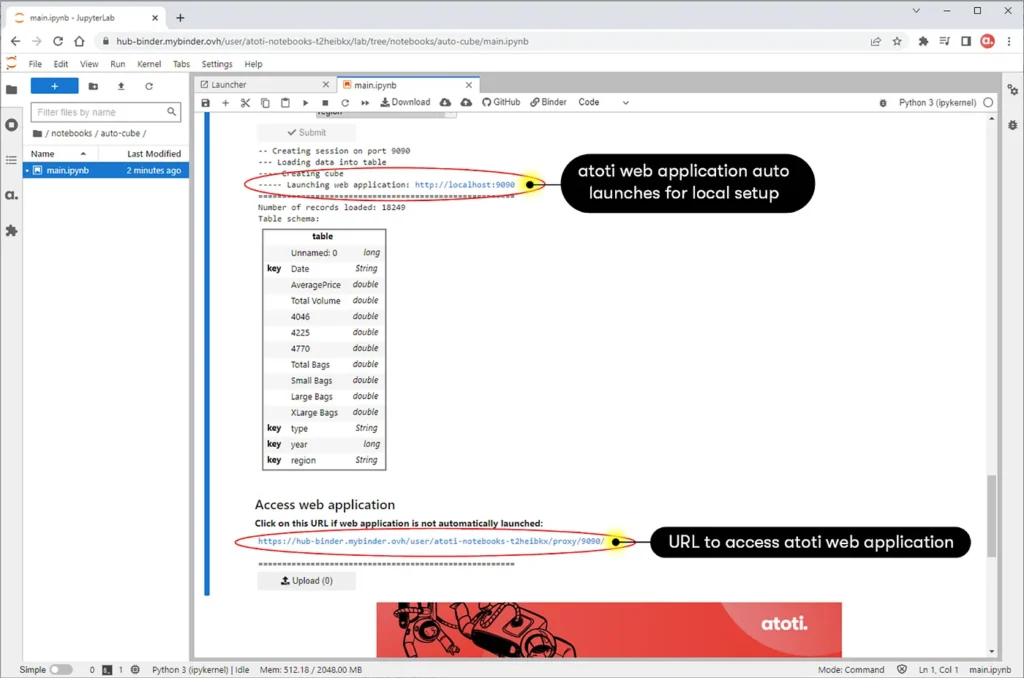
However, if you are running the notebook from a server on e.g. the cloud, the URL depends on the domain or IP address of your instance. This can be seen from the screen capture above, where the web application URL is not localhost.
4. Build your dashboard
Finally, you can now start building your dashboard interactively from the web application! Refer to the GIF at the beginning of the article if you’re not sure how to do so.
You can easily restart with a new dataset simply by uploading a new CSV!
Technologies behind the scenes: Atoti & ipywidget
Use Atoti to create a BI analytics platform
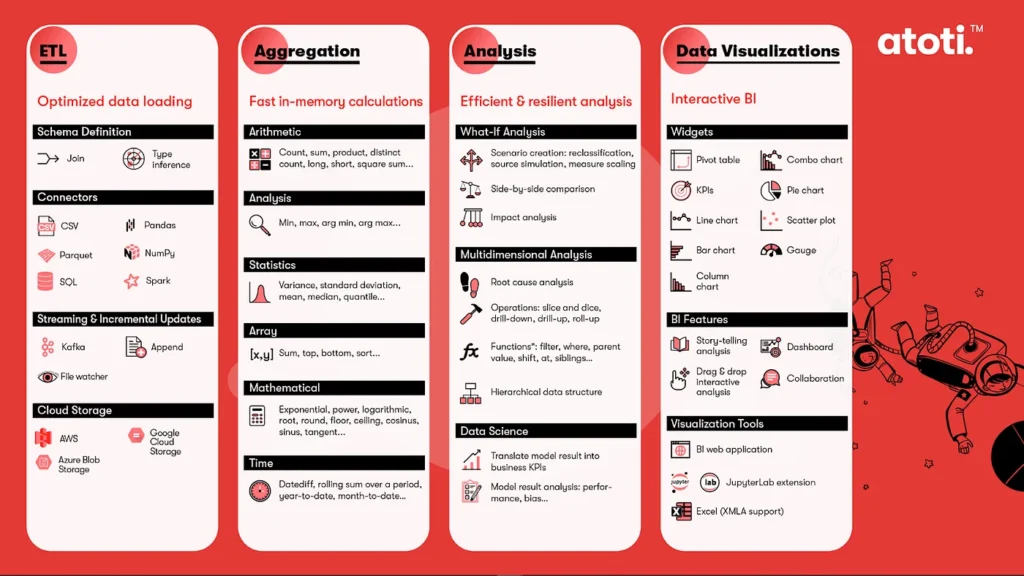
The program revolves around Atoti, a free Python library that allows users to spin up an in-memory data cube, and perform complex aggregations and visualizations. It also comes with a web application that allows users to build and share dashboards.
This program demonstrates the simplest way to use Atoti, i.e. creating a single table data cube. All it takes is the following steps to spin up a cube:
import Atoti as tt

# instant Atoti session with a fixed port
session = tt.Session(port=9090)

# read CSV and create an Atoti table
tbl = session.read_csv("ds_salaries.csv", table_name="table", keys=keys)

# create data cube with the above table
cube = session.create_cube(tbl)

# optional - print schema of the data cube
cube.schema

# access web application via the returned URL
session.link()
Use ipywidget to trigger Atoti cube creation
The main purpose of this program is for users to quickly create a BI analytics platform. In order to make things easier, I used ipywidget to wrap around Atoti for an interactive experience.
For instance, I’ve used the following:
- FileUpload: Users can interactively select CSV from the explorer.
- SelectMultiple: Users can select the keys for the table to be created.
- FloatProgress: To show the progress towards application launch
“Upload file upload” will trigger the instantiation of Atoti.Session and the subsequent steps. Refer to the notebook to see how it’s integrated together with Atoti.
Now, users can create a BI analytics platform without any coding!
Experience Atoti with Binder
I have always wanted to try Binder and here’s my chance!
The Binder Project is an open community that creates BinderHub, where we can create shareable, interactive and reproducible environments. So, now you can open the notebooks from Atoti notebook gallery in an executable environment!
For Atoti to work in Binder, we have added some files in our GitHub repository:
graphviz
libgraphviz-dev
pkg-config- requirements.txt: List dependencies required for Atoti and Graphviz, specifically `Atoti-jupyterlab` is necessary for Binder to include the JupyterLab extension for Atoti in the build.
atoti[jupyterlab,aws,kafka,azure,gcp]>=0.6.6
jupyter-server-proxy
pygraphviz- runtime.txt: Define the version of Python to use. Atoti requires minimally version Python 3.8.
python-3.8Refer to the binder user guide for more information if you wish to use Binder for your own repository.
Build and launch Atoti repository
Now we can spin up a JupyterLab instance with Binder simply by providing the URL of the GitHub repository: https://github.com/atoti/atoti.
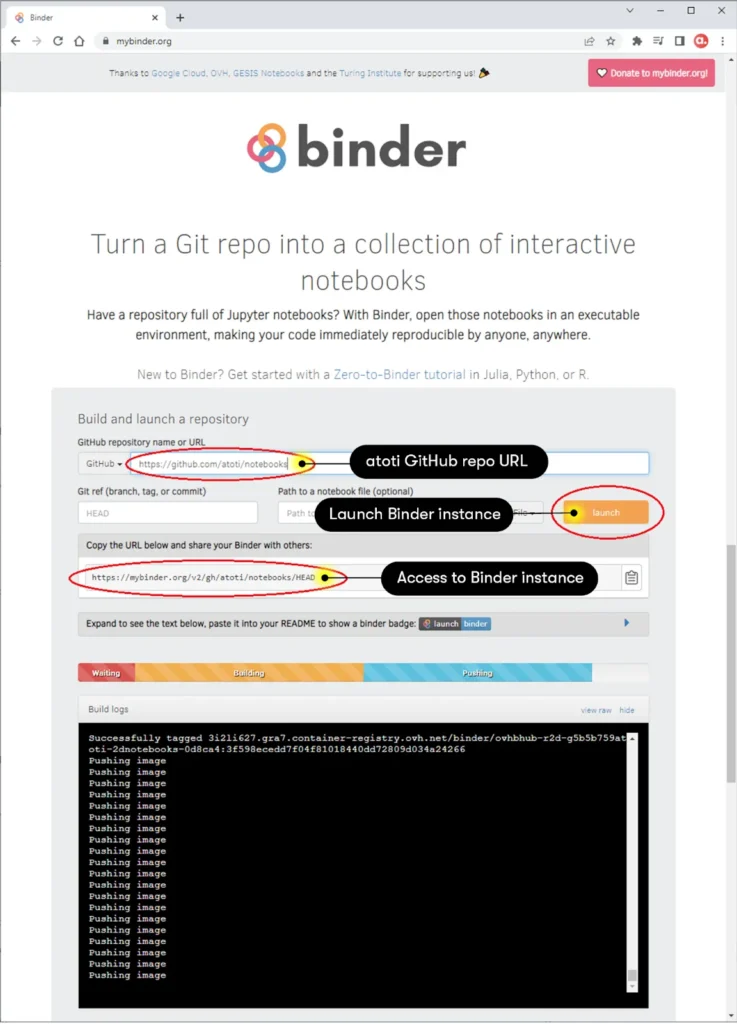
Click the launch button and Binder will start building the environment. Subsequently, a JupyterLab instance launch automatically in the browser. You could also copy the URL and share the Binder with others.
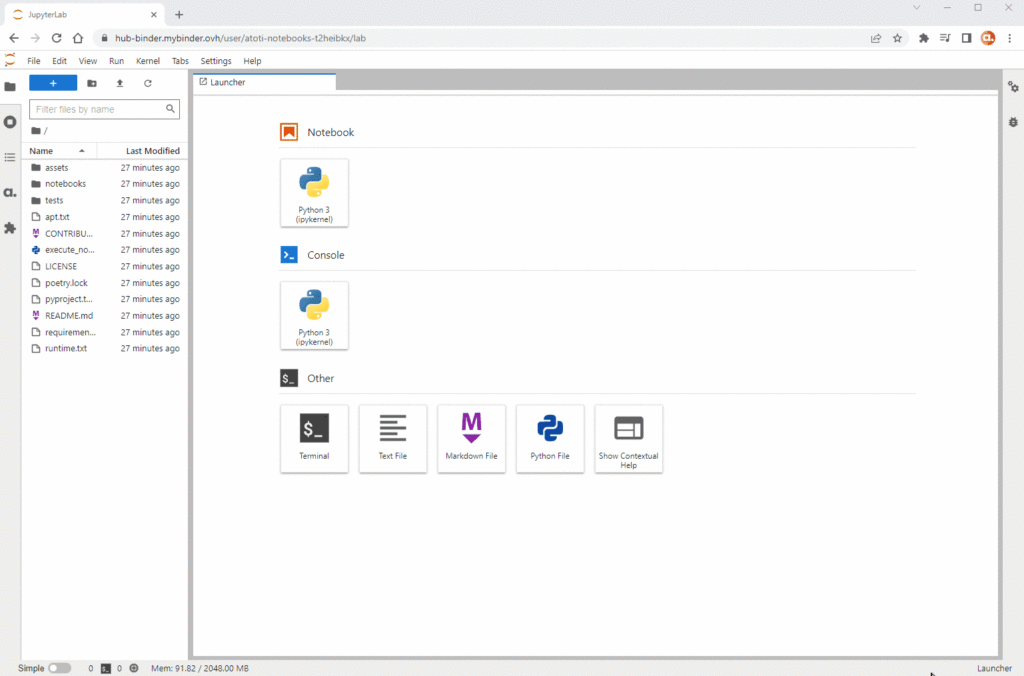
Try Atoti automatic cube creation in Binder
In the JupyterLab, navigate to notebooks > auto-cube and launch the main.ipynb to start playing around Atoti with your own data!
To access the web application, simply click on the displayed URL as shown below:

Have fun! But remember, each Binder instance is allocated 1 to 2 GB of RAM. So, do choose a smaller dataset if you want to give it a try. Otherwise, install Atoti on your local machine for greater control and flexibility!