

Digital marketing is ubiquitous. Learn how you can get real and tangible results from your digital marketing campaign by building a dashboard that helps you to monitor the KPIs. Here, we will leverage the marketing campaign data using Atoti and build a digital marketing dashboard from scratch.
Importance of Digital Marketing
89% of Americans go online at least daily, and 31% are online almost constantly. As a marketer, it’s important to take advantage of the digital world with an online advertising presence by building a brand and providing a great customer experience that brings more potential customers.
Digital marketing, also called online marketing, is the promotion of brands to connect with potential customers using the internet and other forms of digital communication. This includes email, social media, and web-based advertising, and text and multimedia messages as a marketing channel.
What are the benefits of digital marketing?
Having a strong digital presence will help you in multiple ways:
- It will make it easier to create awareness and engagement both before and after the sale
- It will shorten the buyer’s journey by presenting the right offers at the right time
Approach That Gets Real Results
So now that you understand the importance of digital marketing, the important thing is to optimize your strategy and recalibrate to see what is working and what is not. The best way to do so is to have a dashboard that reflects the Key Performance Indicators (KPIs) for various aspects of digital marketing.
This digital marketing dashboard, though high level, will let you deep-dive into the details of the metrics.
So, here we will learn which are the various datasets you can get from the various components of digital marketing and then how to build a dashboard from scratch combining all those siloed datasets.
Hence, this article will also try to address the key issue faced by executives globally — to have a single platform to track their diverse KPIs.
Dataset
In the digital marketing world, you will see many different datasets that come from various facets — Newsletters/Email Campaigns, Social media details — how your company’s followers have evolved over time. Then for social media, there is a dataset for the posts regarding likes, shares, and comments. Finally, we have the web analytics data from the website. This would be about the website visitors’ demographics, the top pages, etc.
Dataset 1: Web data
Dataset 2: Email Campaign/Newsletter Data
Dataset 3: Social Media Dataset
Where did we get this data?
In a real-world scenario, these datasets would have contained a lot of sensitive information about the company’s digital marketing strategy. And hence, would have been very hard to access.
So we have synthesized our own dataset. Here also, we have used the faker python library for the same. You can read about another article we published on Synthetic Data Generation and its importance.
Building the Digital Marketing Dashboard from siloed datasets.
Here, as we have seen above, we will be analyzing the information from the various datasets one by one and then compiling it all in a dashboard.
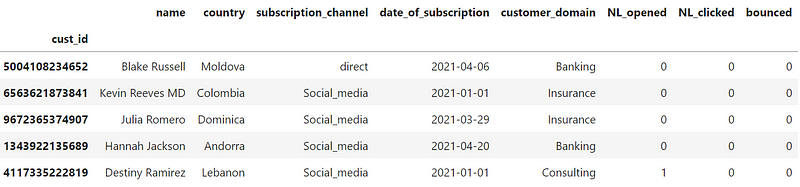
Email Campaigns
The first section is on the various Email campaigns run by the company. Launching a marketing campaign without tracking its performance is like buying a car with a punctured tire. It will not get you anywhere.
Once you have launched an email campaign, you must follow the key metrics like How many people open your emails? How many people click your links? Which link gets the most clicks? Etc.
This information would help you to not only recalibrate current campaigns but also design and plan future campaigns taking these metrics into consideration.
Here, we see two main visualizations that we have created from the email dataset:
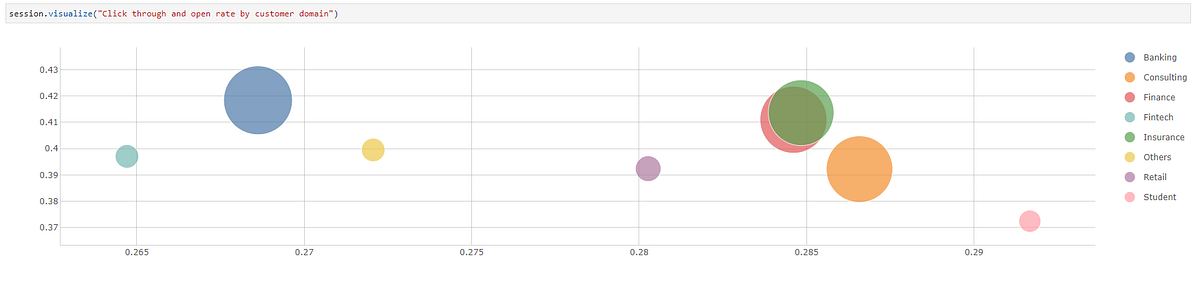
- The first one is on the click-through rate (CTR) and the open rate for the emails for customers in various domains; this could have been extrapolated for the customers in various geographies as well.
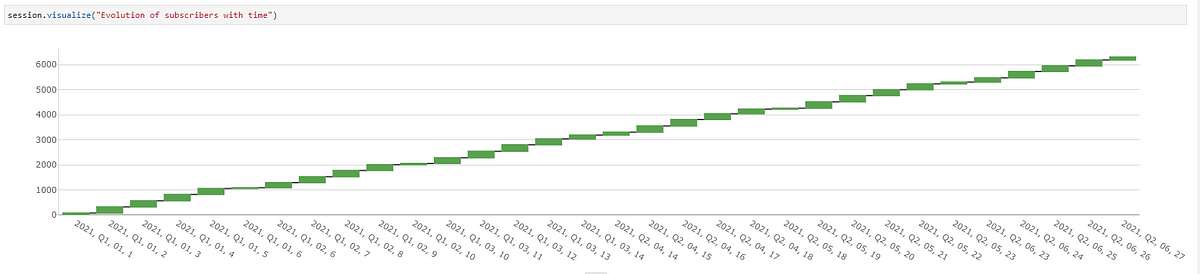
- The second one is for the evolution of the total number of subscribers. This shows the net new subscribers; news subscribers minus people who unsubscribed.
Here it is important to not that with Atoti we can create multiple cubes from the various datasets and then build a common dashboard with widgets from these cubes.
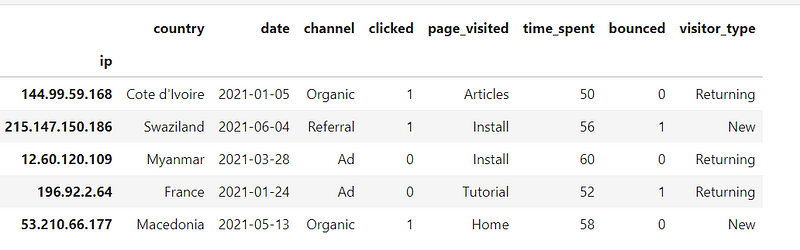
Web Analytics
The second section is web analytics, summarizing the performance of the website. In this section, we talk about the visitors to the company website. Who visited our website? Which page did they visit? How long did they stay on that page? From where were they redirected to our website?
This information can be useful to redesign the website to make sure that we are redirecting the visitors towards the target pages(buy/download etc.). Web analytics can also help us review the success of our various campaigns for ad words etc.
Here also, we can see two main visualizations we created in Atoti on the web analytics data:
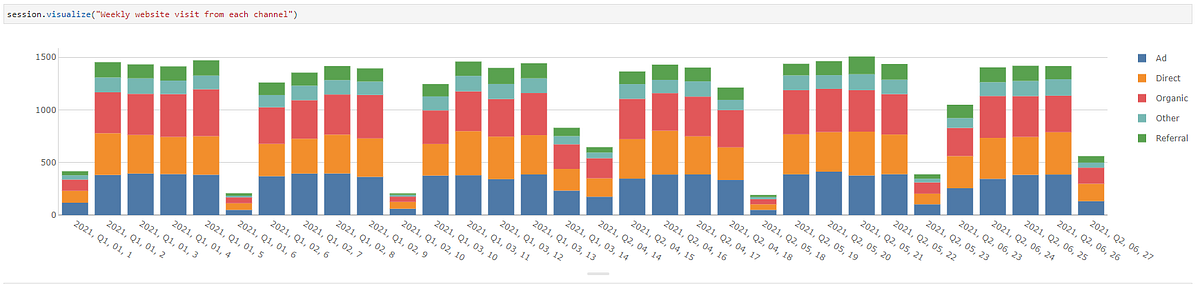
- Weekly visitors- How many people visited our website from various sources like Ad, Direct, Organic search, etc.
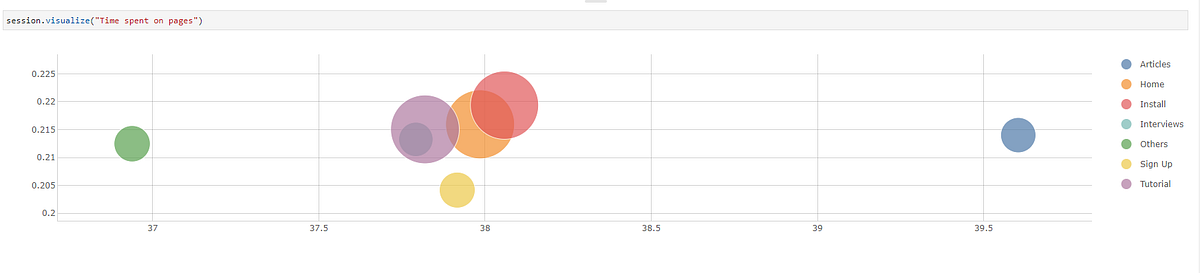
- Time Spent on various pages — Which are the top pages people are spending the most time on? And how many people are spending how much time on which page?
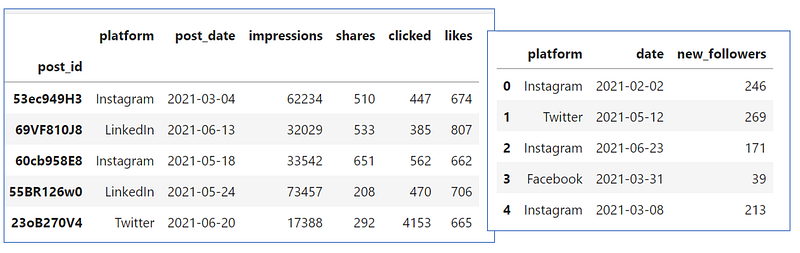
Social Media and Campaigns
Finally, we have social media campaigns. Nowadays your social media presence is one of the most critical aspects of your company’s online presence.
Here, we had two datasets; the first one is on the posts — how many post have we shared, on which platform, how did the post perform in terms of likes, clicks, shares, etc. And then, there is a dataset for the various social media platforms to see the evolution of the followers on the different platforms over time.
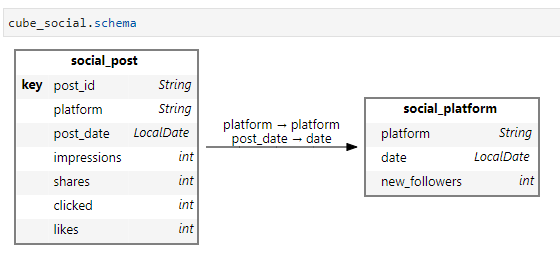
Here, we have created a cube combining these two data frames by the platform and date. And hence, we shall be building new visualizations based on this new cube.
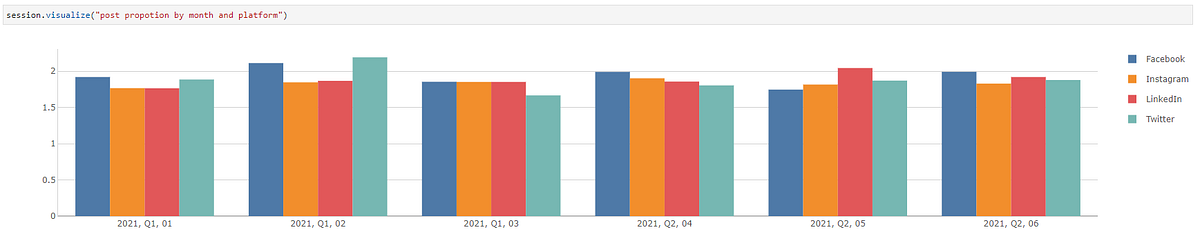
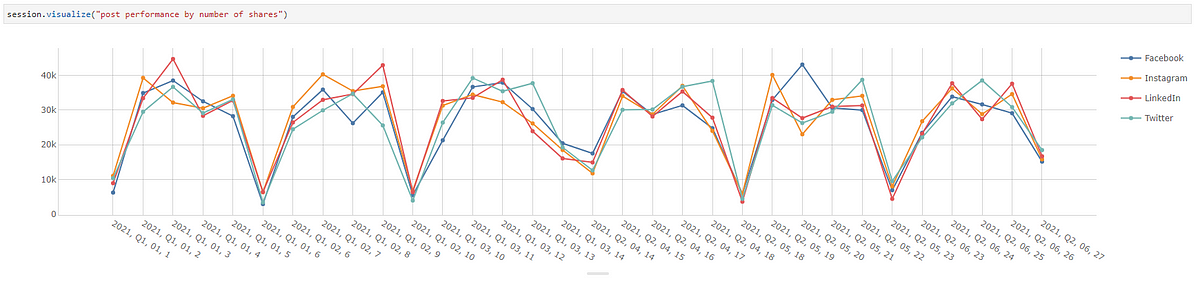
Here, we can see how much content we create on a monthly basis for various social media platforms. And then, in the second visualization, we can gauge the success of our posts by the number of shares on different platforms.
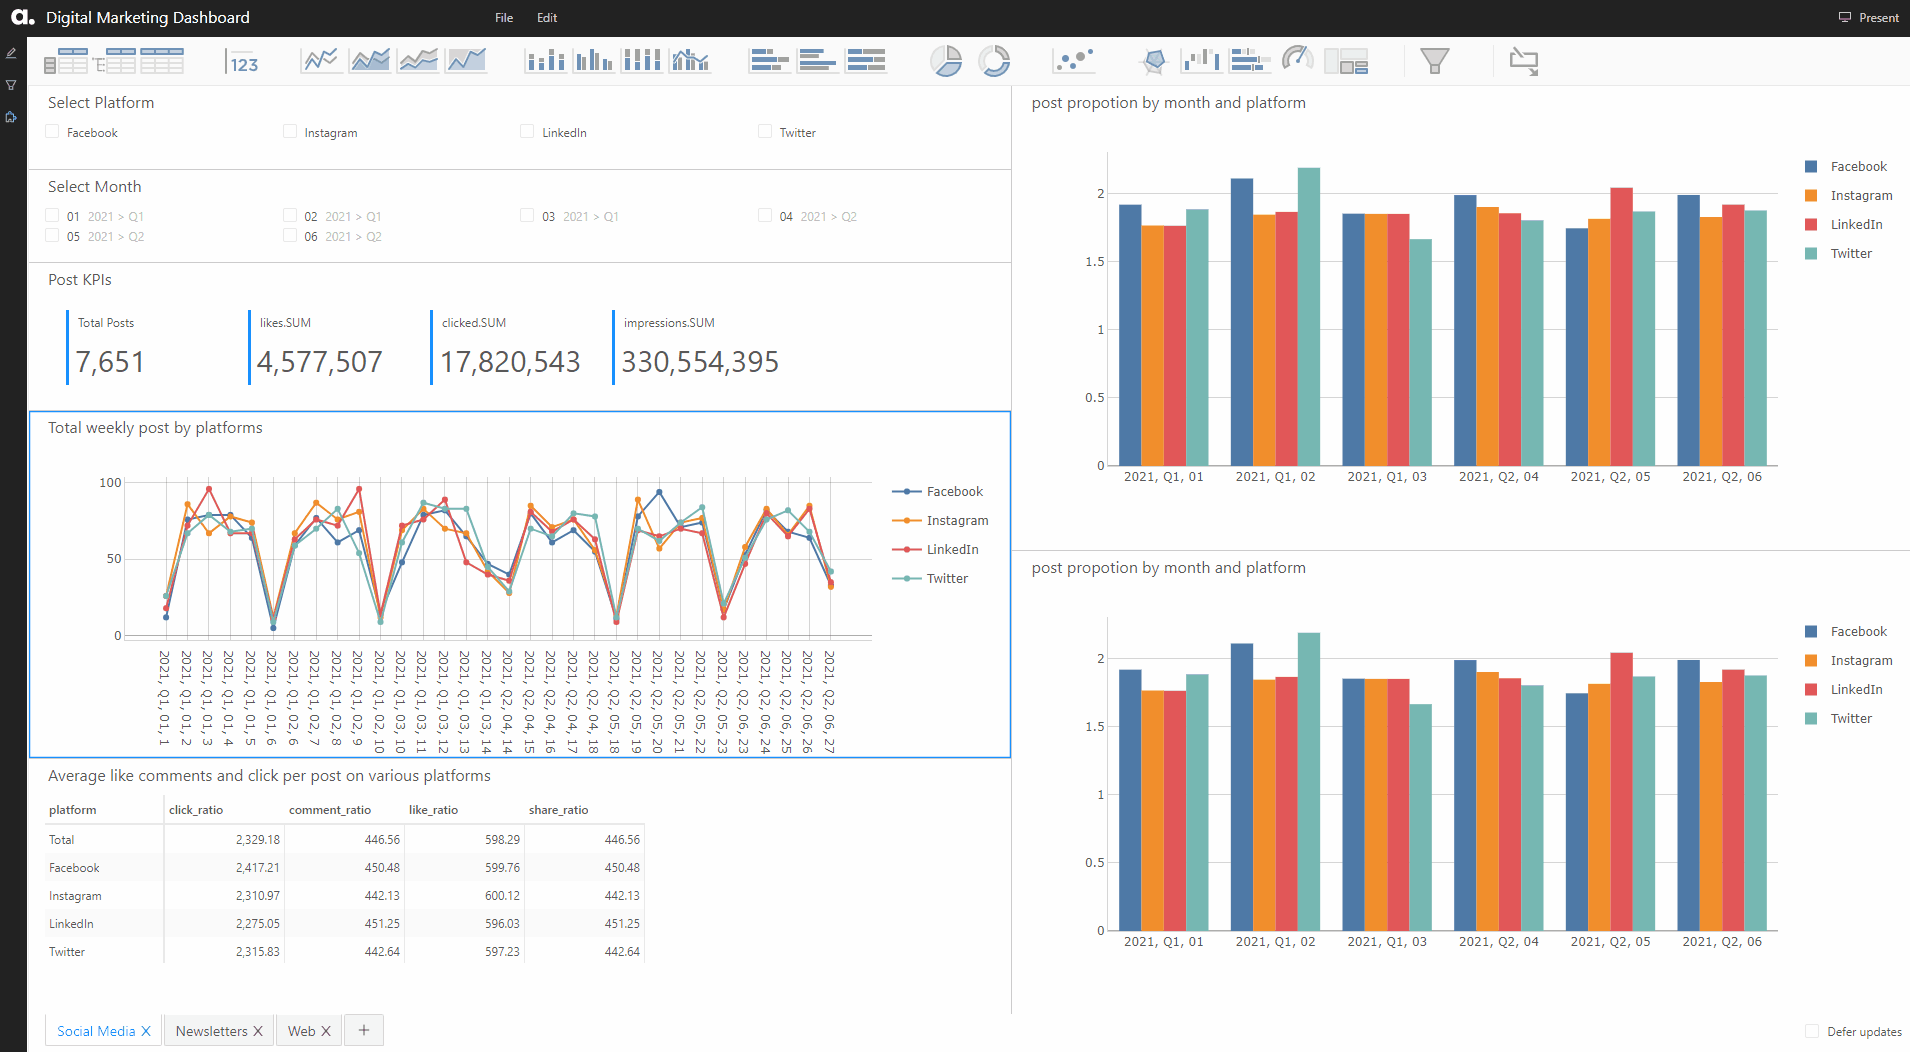
Merging the widgets in a dashboard.
Finally, we combine all the above information coming from totally different data sources into a single dashboard.
This interactive dashboard has three main tabs for the three areas we explored — Social Media, newsletter, and web. Hence, this will enable the end-user to navigate to the area of their interest and follow all the KPIs in a single place.
Each page of this dashboard has multiple filters for time, social media platform, customer domain, etc. Hence, users can slice and dice the data as they want along the various axes.
Conclusion:
In this article, we have seen how to leverage the maximum potential of your digital marketing efforts by building a dashboard and monitoring all KPIs from a single place.
To achieve the same in a world without Atoti would have meant juggling multiple platforms and (probably) missing the story those KPIs are trying to tell you!
For the detailed source code and many other interesting use cases, check out the Atoti notebook gallery on GitHub. This digital marketing dashboard can be found here.

