Create an OLAP cube from your relational database with minimal ETL effort
You probably know what RDBMS is since you are reading this article. Most probably, you have also dealt with some reporting tools that are backed by relational databases. So, what do you know about multidimensional analysis?
In order to give you an idea of multidimensional analysis, think of the Pivot Table in Microsoft Excel.
While relational databases store data in a two-dimensional table format using rows and columns, multidimensional cubes allow users to drill down into different dimensions and draw insights from different viewpoints.
By grouping data into dimensions and measures, multidimensional cubes shield the users away from the underlying data structure. Front-end users can simply select the hierarchies and measures that they need, knowing the relationships between data are established upon the creation of the cube.
Like the flexibility that empowers users to build their own dashboards that allow them to perform the multidimensional analysis? Just imagine the amount of SQL and UI coding required to allow users to select any group of data for their analysis.
So go ahead, ditch your existing relational databases and get yourself a multidimensional database! Now, hold your horses~~~
Instead of doing an overhaul of your systems, there are tools that allow you to create multidimensional cubes on top of your existing databases.
Creating a multidimensional cube on top of the relational database
Atoti is a free Python library that can connect to different types of data sources to create multidimensional cubes. Once the cube is created, you will be able to visualize data either in Jupyter notebooks or in the Atoti BI application that comes with the library.
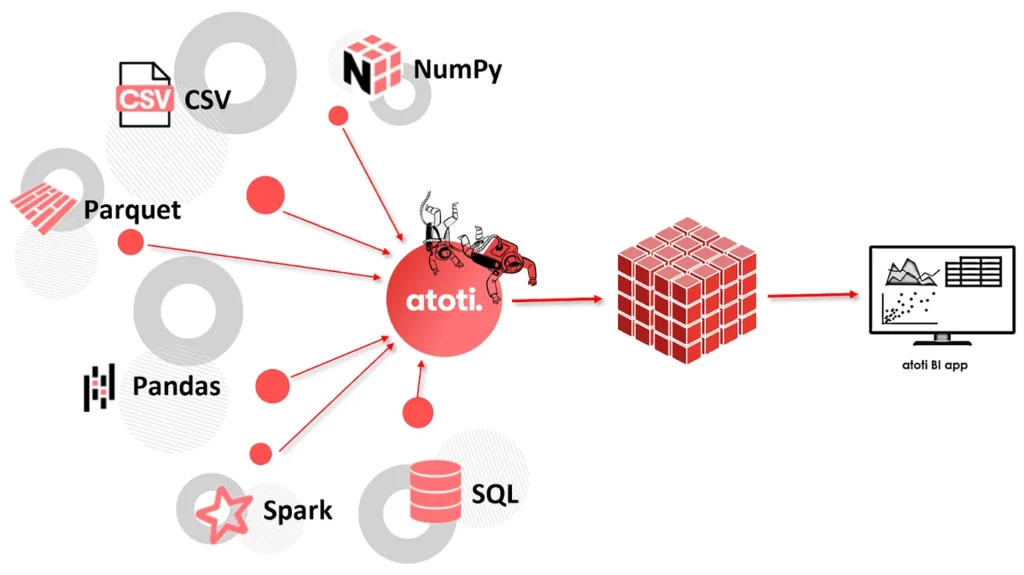
Among all the supported connectors, we are going to see how we can utilize the SQL connector to create a cube on top of the existing database.
Installing Atoti and its dependencies
Before we can use the Atoti and its SQL connector, we need to install Atoti and atoti_sql package:
pip install atoti[jupyterlab,sql]Supported SQL databases
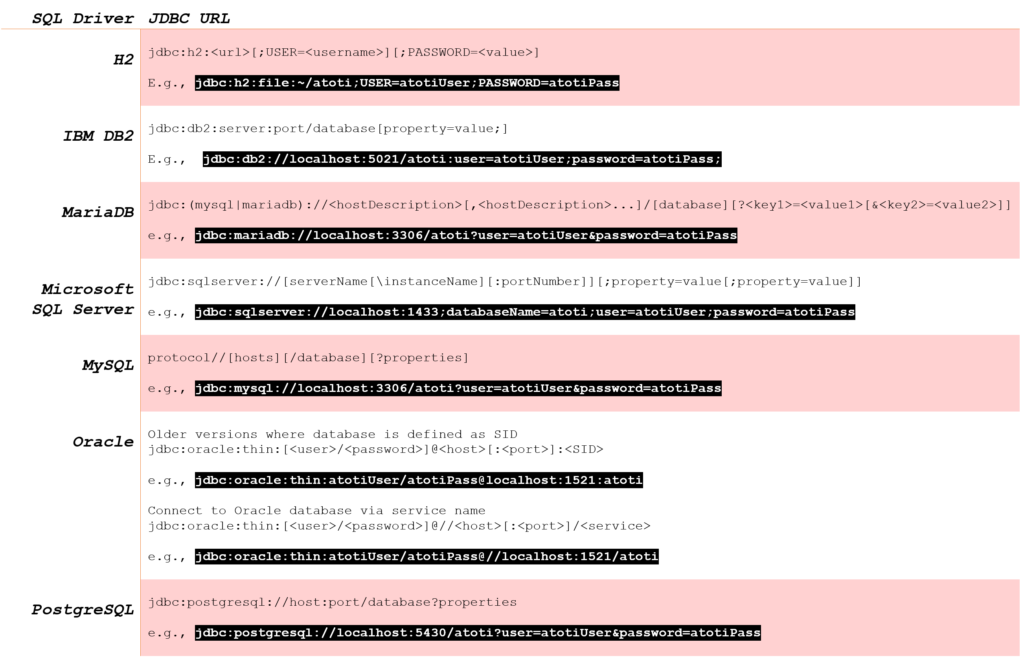
Atoti supports the below SQL drivers natively and therefore, no additional configuration for these databases. However, we will be connecting to the database via JDBC URL. Refer to the table for the format of the JDBC URL of the supported databases.
Configuration for databases outside the supported list
In the event you have a database that is not within the above list, see if the database has its own JDBC driver. You’ll probably find the JDBC JAR for the database from its website, such as the following links:
Download the JDBC JAR and add its path to the `extra_jars` parameter in Atoti’s session configuration during the Atoti session creation:
session = tt.create_session(
    config={
        "extra_jars": ["./driver/vertica-jdbc-11.0.0-0.jar"],
    }
)
Initial data loading from database to Atoti
Before we can load the data, we will need to create an Atoti session as shown in the example above. If the database driver is supported natively, we skip the extra_jars configuration and simply create the session as shown below:
import Atoti as tt
session = tt.create_session()
We are now ready to load data from the database into Atoti tables! For natively supported databases such as MS SQL Server, we can simply perform a SQL select from the intended table(s) as follows:
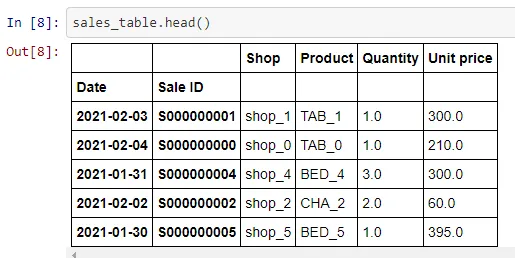
sales_table = session.read_sql(
    "SELECT * FROM [Atoti].[Atoti].[sales];",
    url="jdbc:sqlserver://localhost:1433;databaseName=Atoti;user=AtotiUser;password=AtotiPass",
    table_name="sales",
    keys=["Sale ID", "Date"],
)
In order to connect and read from the database, we configured the url parameter with the JDBC connection string, along with the user and password. Examples of JDBC connection strings for each supported database are provided in the previous table.
The above code snippet creates an Atoti table named sales with Sale ID and Date as its keys.
The main difference in the loading of data for databases outside of the natively supported list is that we have to declare its driver class:
policy_tbl = session.read_sql(
    """SELECT CUST_ID , PP.POLICY, POLICY_STATUS, 'Property' AS POLICY_TYPE,
    DATE(QUOTE_DATE) AS QUOTE_DATE, DATE(COVER_START) AS COVER_START,
    DATE(LAPSED_DATE) AS LAPSED_DATE, DATE(CANCELLED_DATE) AS CANCELLED_DATE, DATE(MATURITY_DATE) AS MATURITY_DATE,
   PAYMENT_METHOD,PAYMENT_FREQUENCY,SUM_INSURED,OWNERSHIP,PLAN_TYPE,BASIC_PREMIUM, NUM_SUBPOLICY, 'N' as IS_SUB
    FROM POLICY_PROPERTY PP
    LEFT JOIN (SELECT POLICY, COUNT(DISTINCT(SUB_POLICY)) AS NUM_SUBPOLICY FROM ADDITIONAL_COVERAGE GROUP BY POLICY) ADDONS ON ADDONS.POLICY = PP.POLICY;""",
    url="jdbc:vertica://192.168.56.101:5433/VMart?user=dbadmin&password=password",
    table_name="policy",
    keys=["CUST_ID", "POLICY"],
    driver="com.vertica.jdbc.Driver",
)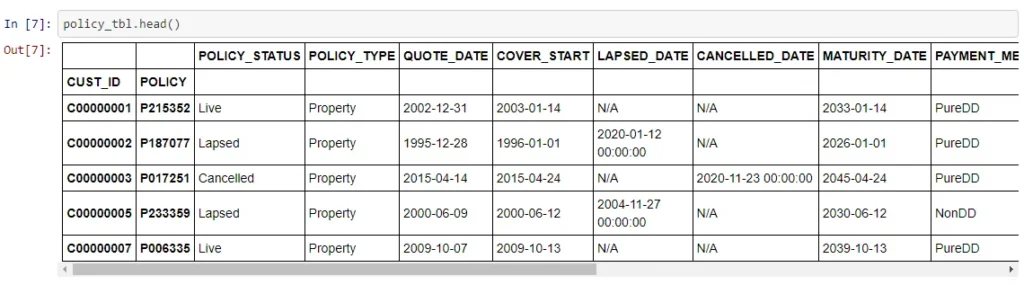
head function to get a preview of the data in the table.The above example connects to a Vertica database and loads the results of a join select into the newly created Atoti table `policy`.
We can find the JDBC connection string format on Vertica’s website.
It is important to know that data loaded into the Atoti table is in fact, held in memory on the server where the Python script is running on. This means that:
- data is not being persisted on the machine storage
- in-memory computing paradigm provides faster querying operations and real-time analytics
- the server has to have adequate memory to hold the data and perform aggregation
With regards to point 3, we can prevent an entire database read by applying filtering conditions on the SQL select statement during data loading. Dropping data from the Atoti table to purge stale data will also help to reduce the data load:
policy_tbl.drop({"POLICY_STATUS": "CANCELLED"})Incremental data loading into Atoti table
We use the session function read_sql to create an Atoti table as we load data. In addition, the library also supports incremental data loading, which means that we need not restart the server to reload the data.
For incremental loading, use the table function load_sql to load data into existing tables.
policy_tbl.load_sql(
    """select CUST_ID ,POLICY, POLICY_STATUS, 'Vehicle' as POLICY_TYPE,
    DATE(QUOTE_DATE) as QUOTE_DATE, DATE(COVER_START) as COVER_START,
    DATE(LAPSED_DATE) as LAPSED_DATE, DATE(CANCELLED_DATE) as CANCELLED_DATE, DATE(MATURITY_DATE) as MATURITY_DATE,
    PAYMENT_METHOD,PAYMENT_FREQUENCY,SUM_INSURED,OWNERSHIP,PLAN_TYPE,BASIC_PREMIUM, 0 as NUM_SUBPOLICY, 'N' as IS_SUB
    from policy_vehicle;""",
    url="jdbc:vertica://192.168.56.101:5433/VMart?user=dbadmin&password=password",
    driver="com.vertica.jdbc.Driver",
)
This function comes in handy when you want to load delta data from the same database table. It’s interesting to know that the SQL used in this incremental loading can be different from the initial loading. In fact, this particular example selects from a different database table altogether.
After creating an Atoti table, you can even load data from different sources into it. E.g. we can even call the table function load_pandas to load a Pandas DataFrame into the table:
policy_tbl.load_pandas(other_policies)Creating multiple tables
Similar to databases, we can have multiple tables in a cube and have them joined by common keys.
coverage_tbl = session.read_sql(
    "select * from coverage;",
    url="jdbc:vertica://192.168.56.101:5433/VMart?user=dbadmin&password=password",
    table_name="coverage",
    keys=["POLICY", "COVERAGE_TYPE"],
    driver="com.vertica.jdbc.Driver",
)

policy_tbl.join(coverage_tbl)
Remember, these tables can be from any data source. They can be from CSV, Pandas DataFrame or even real-time streams such as Kafka.
Creating multidimensional cube
Once we have the Atoti table created, we can create the cube using the base table:
cube = session.create_cube(policy_tbl, "Insurance")
cube.schema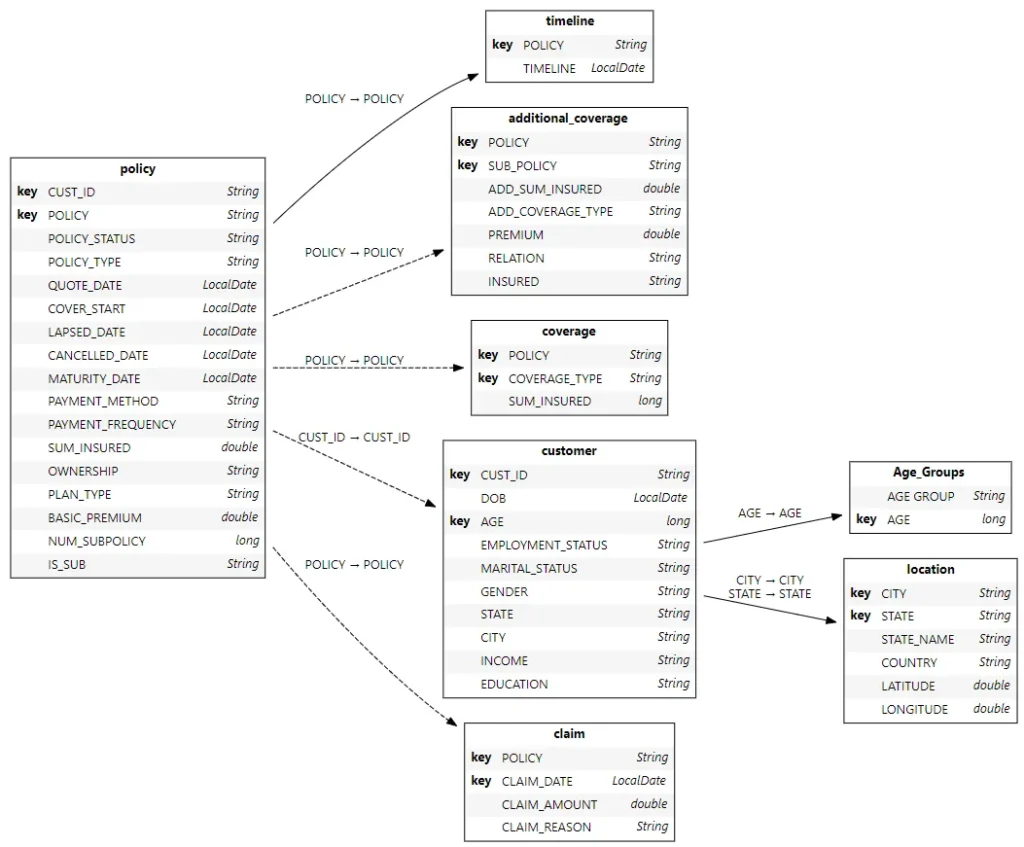
Atoti follows the snowflake schema with the base table containing the most granular level data.
Hierarchies and measures creation
During cube creation, key columns and non-numerical columns are created as single-level hierarchies. On the other hand, numeric columns from the base table are created as sum and mean measures. As for the referenced tables, we can always create measures for their numerical columns if necessary:
m["Claim Amount"] = tt.agg.sum(
    tt.value(claim_tbl["CLAIM_AMOUNT"]), scope=tt.scope.origin(l["POLICY"])
)
We can also go into manual creation mode where the cube does not automatically create the hierarchies and measures for us. Refer to the documentation for the modes available. Similarly, have a look at the tutorial for examples of aggregation that can be done with Atoti!
Performing multidimensional analysis
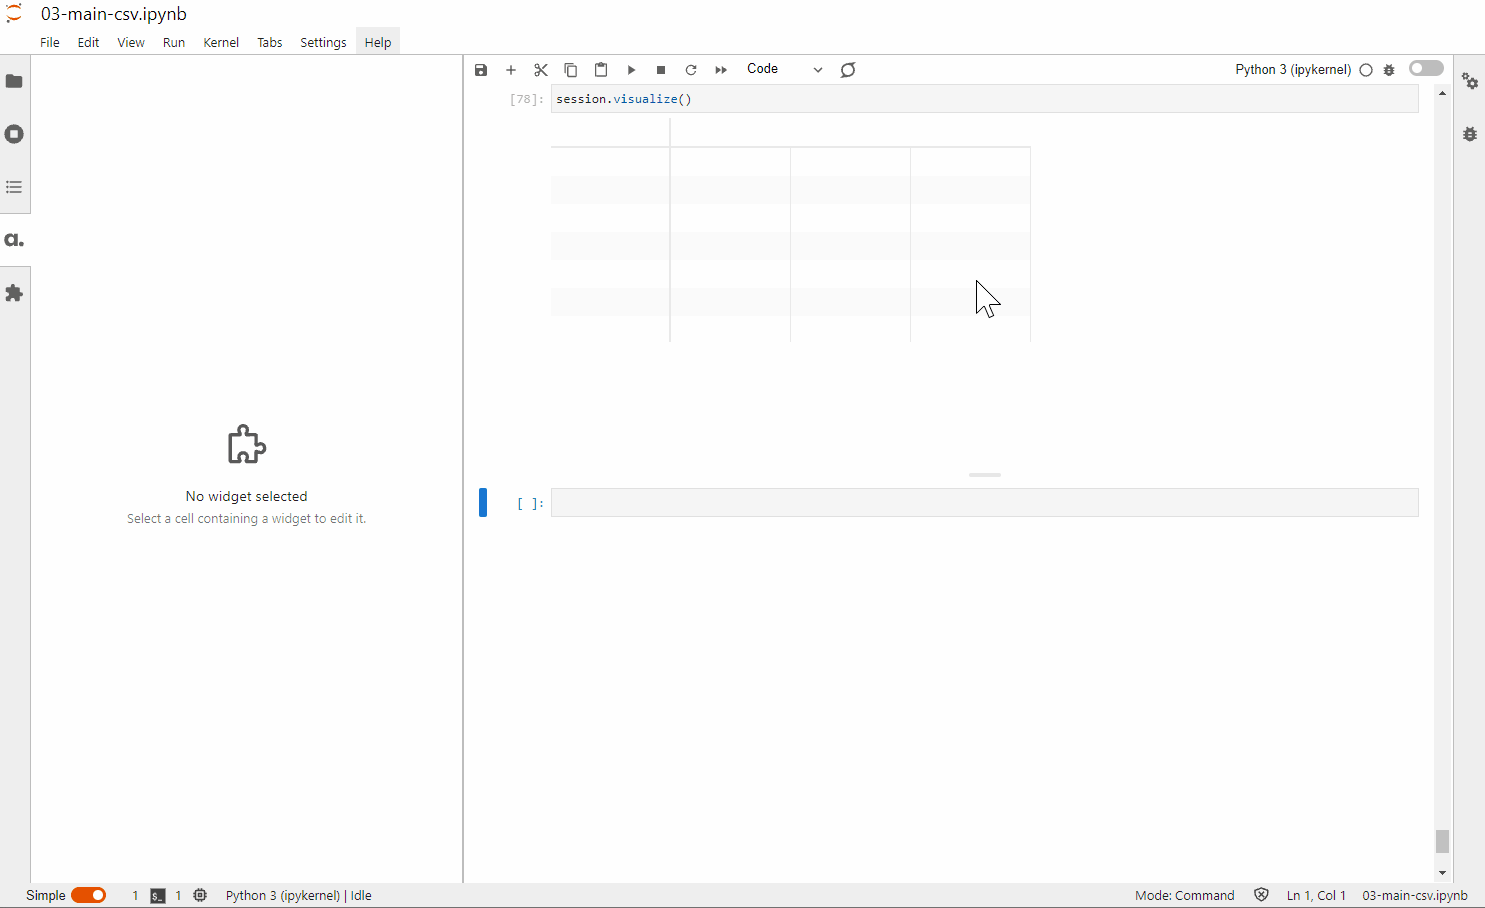
Upon the creation of the cube, we can start our multidimensional analysis. There are two ways to go around it.
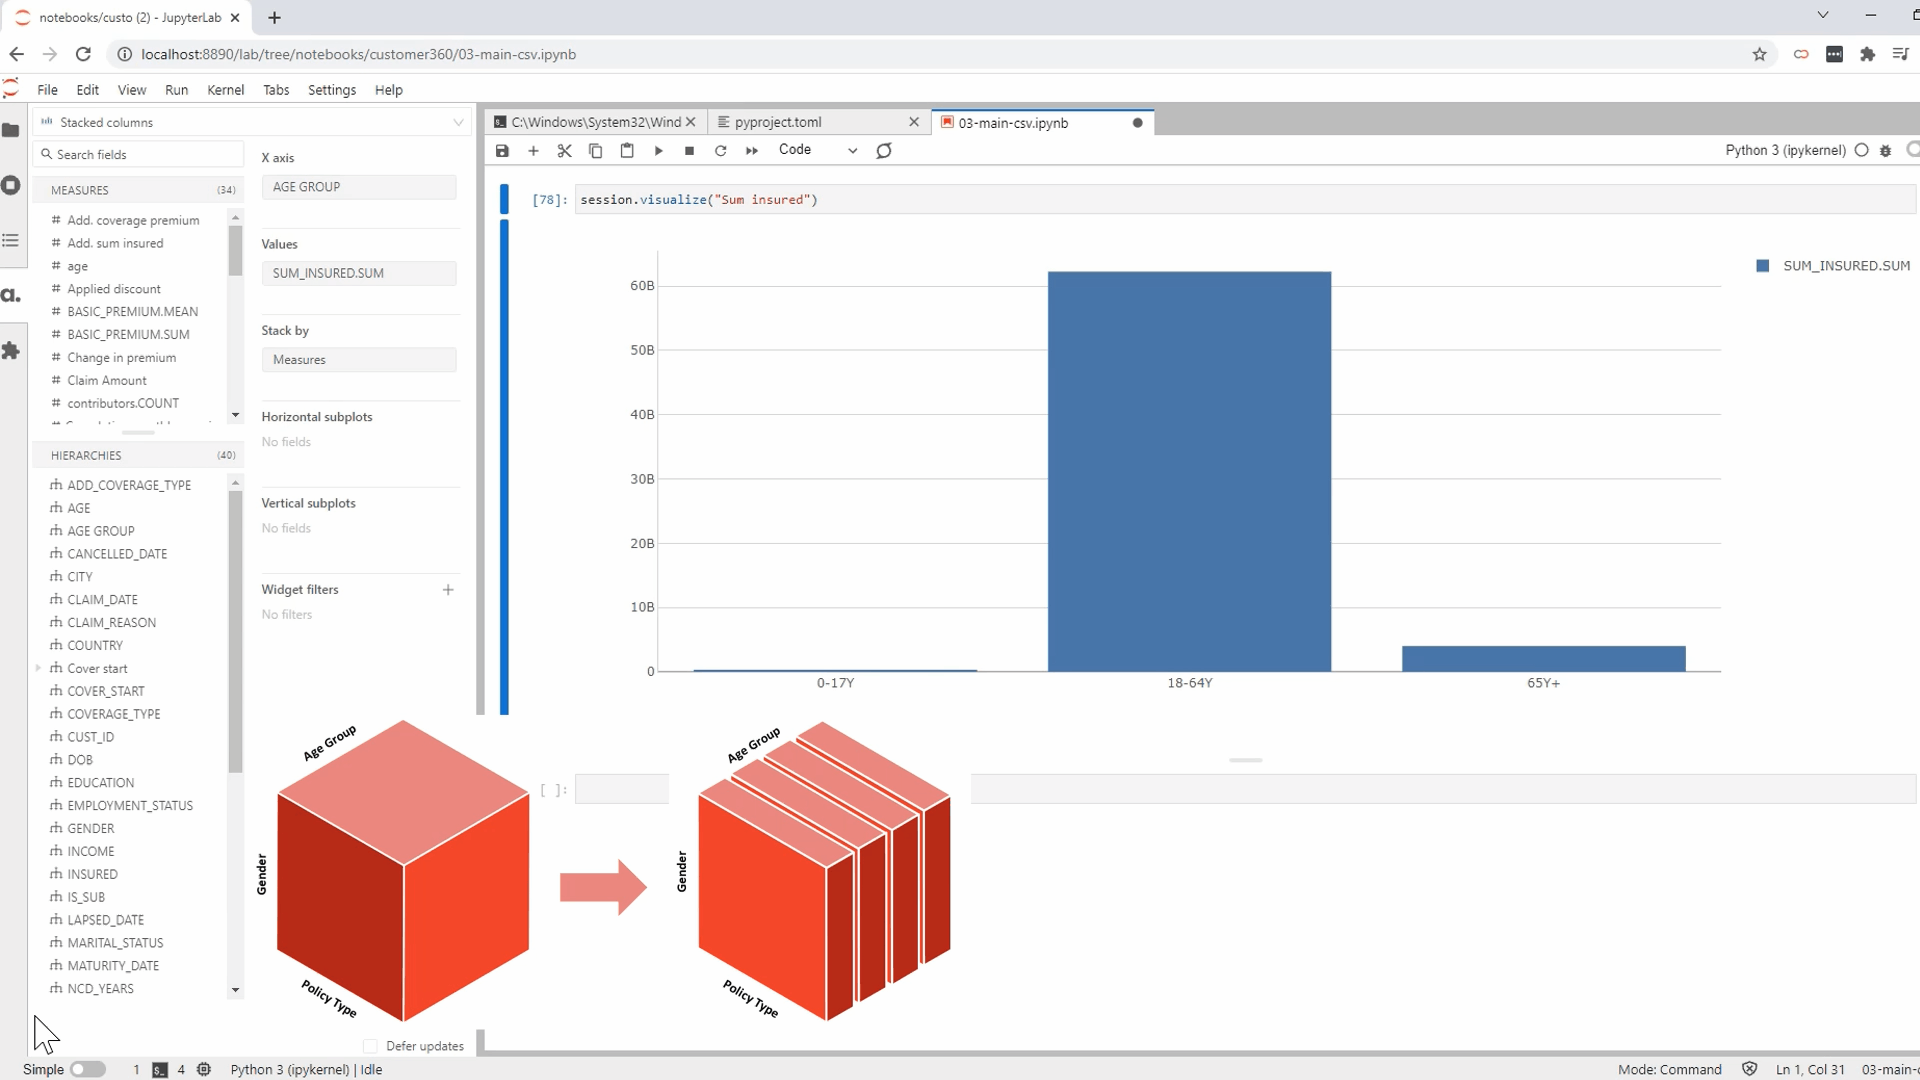
1 – For those who are tech-savvy, leverage the Atoti JupyterLab extension to perform visualization as you build your data model.
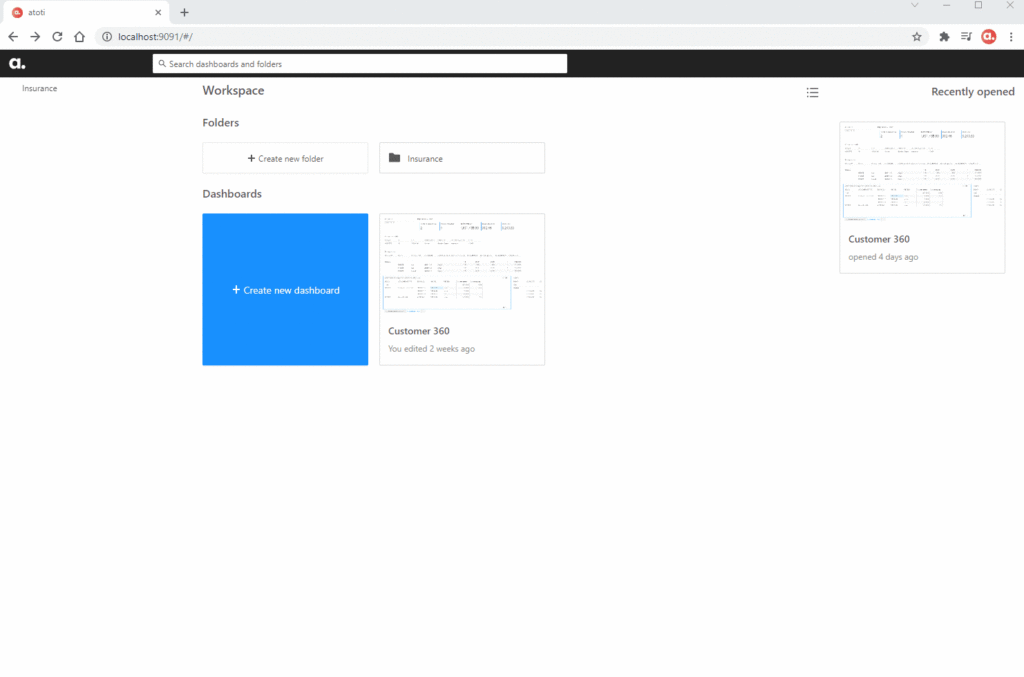
2 – For end users, simply access the Atoti BI application using session.link() and start building the dashboard.
Safeguarding the integrity of the database
By creating an Atoti cube on top of the relational database, we kept changes to the underlying data layer minimal. It is good to know that it is a one-way data flow from the database into Atoti. So, we always maintain the integrity of the data source.
Since Atoti is a complete BI analytic platform, there’s also no need for additional UI applications for dashboarding and reporting. One library is all you need!
Read more about getting started with Atoti and check out Atoti notebook gallery for the sample notebook connecting to Vertica database.