See how we expanded our Atoti and external optimizer integration use case to include constraints.
Perhaps your company has dedicated itself to moving towards a more climate-conscious investment strategy. Perhaps you have a bad feeling about the near and middle term performance of a certain sector. Or, perhaps you really, really hate the new CEO of a particular company. Regardless of the reason, sometimes you need to construct a portfolio subject to a series of constraints.
In this article (part two of our series about Portfolio Optimization), we demonstrate how we utilize Atoti and an external optimizer to generate an ‘optimal’ equities portfolio based on dynamically chosen constraints.
Read on to learn how we expand on our initial solution, and now integrate constraints on our portfolio optimizer project. Check back in a few weeks for the last part of the series, where we focus on backtesting.
Let’s go!
Background
In our last article, we shared how we got started connecting Atoti to an external portfolio optimizer:
- We downloaded 3 years worth of data from Yahoo Finance using the yfinance library.
- We created buttons for portfolio selection using iPyWidget
- We spun up a BI analytics platform using Atoti
- We optimized portfolios using PyPortfolioOpt
- And we compared the new portfolio options using Atoti’s dashboarding webapp
Having a great baseline for creating new portfolios, it is only natural to wonder if we could go a step further. Could we optimize based on constraints-creating portfolios from a fed-in benchmark, but also minimizing (or maximizing) exposure to certain conditions and still maintain our easy to operate system? The short answer is, of course!
So, how do we do this?
Updates to our base setup

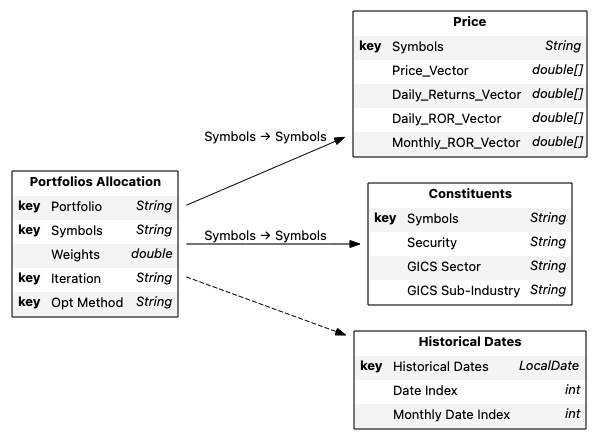
For our new example, much of our base set up remains the same, such as our data model and many of the measures we’ve created. However, there are additional metrics that might be worth exploring, such as Expected Returns, and Information Ratio.
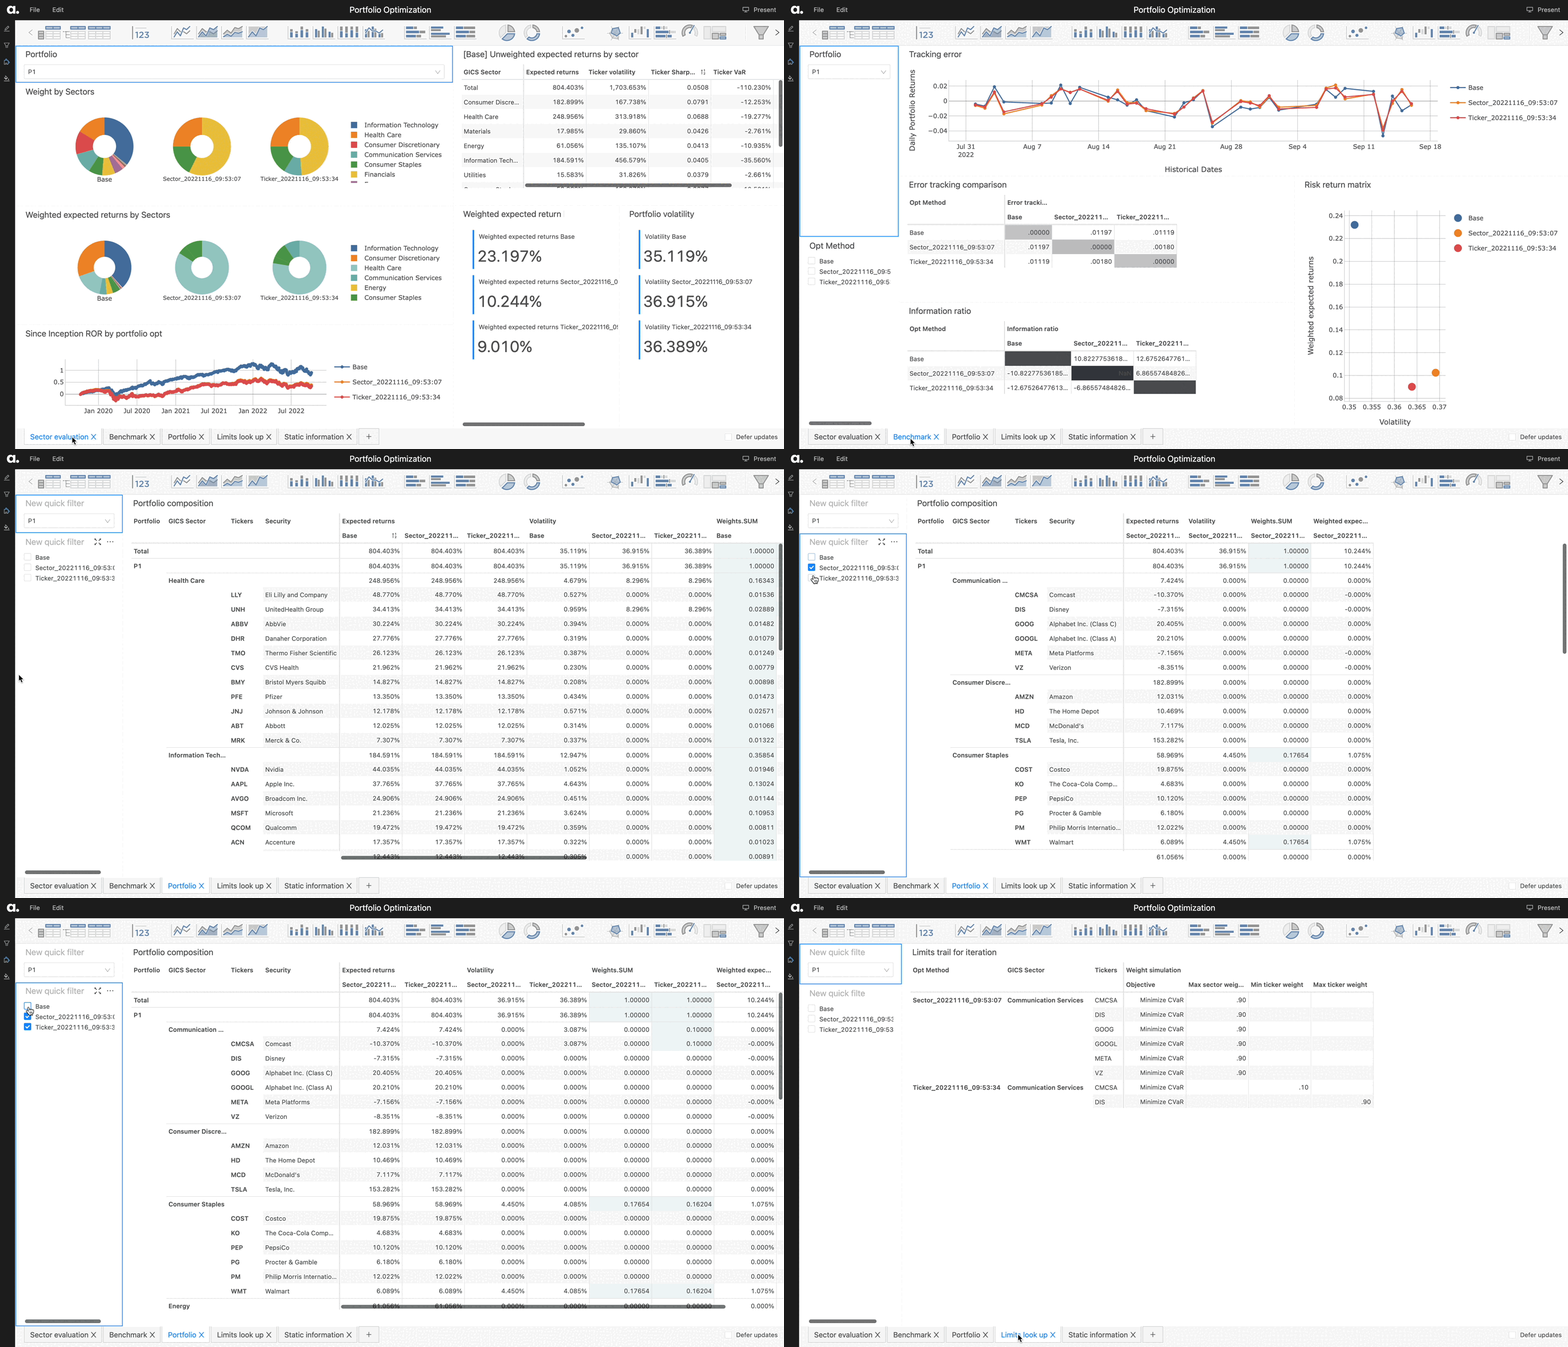
In fact, in this version of our use case, we can compare the benchmark against any iteration using both Error tracking and Information ratio. We can:
- perform optimization on the initial portfolio
- adjust the constraints based on the returned results evaluation
- compare the latest iteration against either the original or the previous iteration.
This means we can immediately benchmark the result of the optimized portfolio and adjust the constraints for the optimizer as many time as we want.
Expected Returns
Expected returns as a measure is particularly interesting, in case we want to optimize based on a specific returns performance. We’ll compute the average expected return based on our daily historical data, then use our weights for each stock to compute the weighted expected returns.
As a part of our optimizer example, we provide an optimizer button based on achieving a target expected return.

Information Ratio
Information Ratio is a valuable measure for determining the effectiveness of a portfolio manager to “beat the benchmark,” so to speak. Computed by dividing the difference between their portfolio returns and the benchmark’s by the tracking error, two things immediately pop out:
- If the IR is negative, then the portfolio manager isn’t beating the benchmark: their returns are less than the benchmark’s
- Since a larger tracking error is indicative of more volatile performance, a larger IR indicates a better return compared to the risk ratio.

Adding in constraints
Much like in our use case where we demonstrated how to integrate an external optimizer with Atoti, we’ll leverage iPyWidget to enable dynamically setting our constraints and we’ll use parameter simulations for storing the selected constraints, rather than being formally stored in a separate table.
To demonstrate the flexibility of the optimizer and of Atoti’s ability to handle varied outputs, we’ve chosen to demonstrate several ways one could constrain the optimization:
- By narrowly selecting one sector in which one wants to optimize

- By setting limitations on the per sector weights

- By setting limitations on the per stock/ticker weight

- And by allowing both sector and ticker specific limitations
Each optimization enriches our existing portfolio table. We utilize this to compare our various portfolio options in a single view in our dashboard, facilitating our ability to easily determine which strategy works best for our objectives. And if we’re happy with the results? We can iterate again, from the originally selected portfolio or from one of our iterations.

Conclusion
This concludes our second part in our Portfolio optimization series, demonstrating how we could add constraints to our optimization problem. Stay tuned for our part three in our series, and for future use cases.
To learn more, check out the corresponding notebook in our notebook gallery. Or reach out to ActiveViam to discuss how we could integrate a constrained optimization program into the BI analytics platform using Atoti+!


