
Learn how to create and manipulate hierarchies in Atoti to generate insights!
Before talking about hierarchies, we should discuss the fundamental concepts of an OLAP cube. Atoti uses what’s known as an Online Analytical Processing (OLAP) cube, which is a multi-dimensional data structure used for analyzing business data through efficient querying and aggregation, empowering decision-makers with valuable insights. When working with OLAP cubes, users should be familiar with the following components:
- Dimensions: Represents a natural category or entity by which data can be organized and analyzed (think data structured in tables, such as an Orders, Products, or Customers table).
- Hierarchies: Represents attributes within a dimension that can consist of a single level, or multiple levels to describe parent-child relationships (think columns of a table, such as an OrderID, OrderDate, etc.).
- Levels: Represents a specific depth or granularity within a hierarchy, such as a multi-level OrderDate hierarchy that can drill-down to the Year, Quarter, Month, and Day levels).
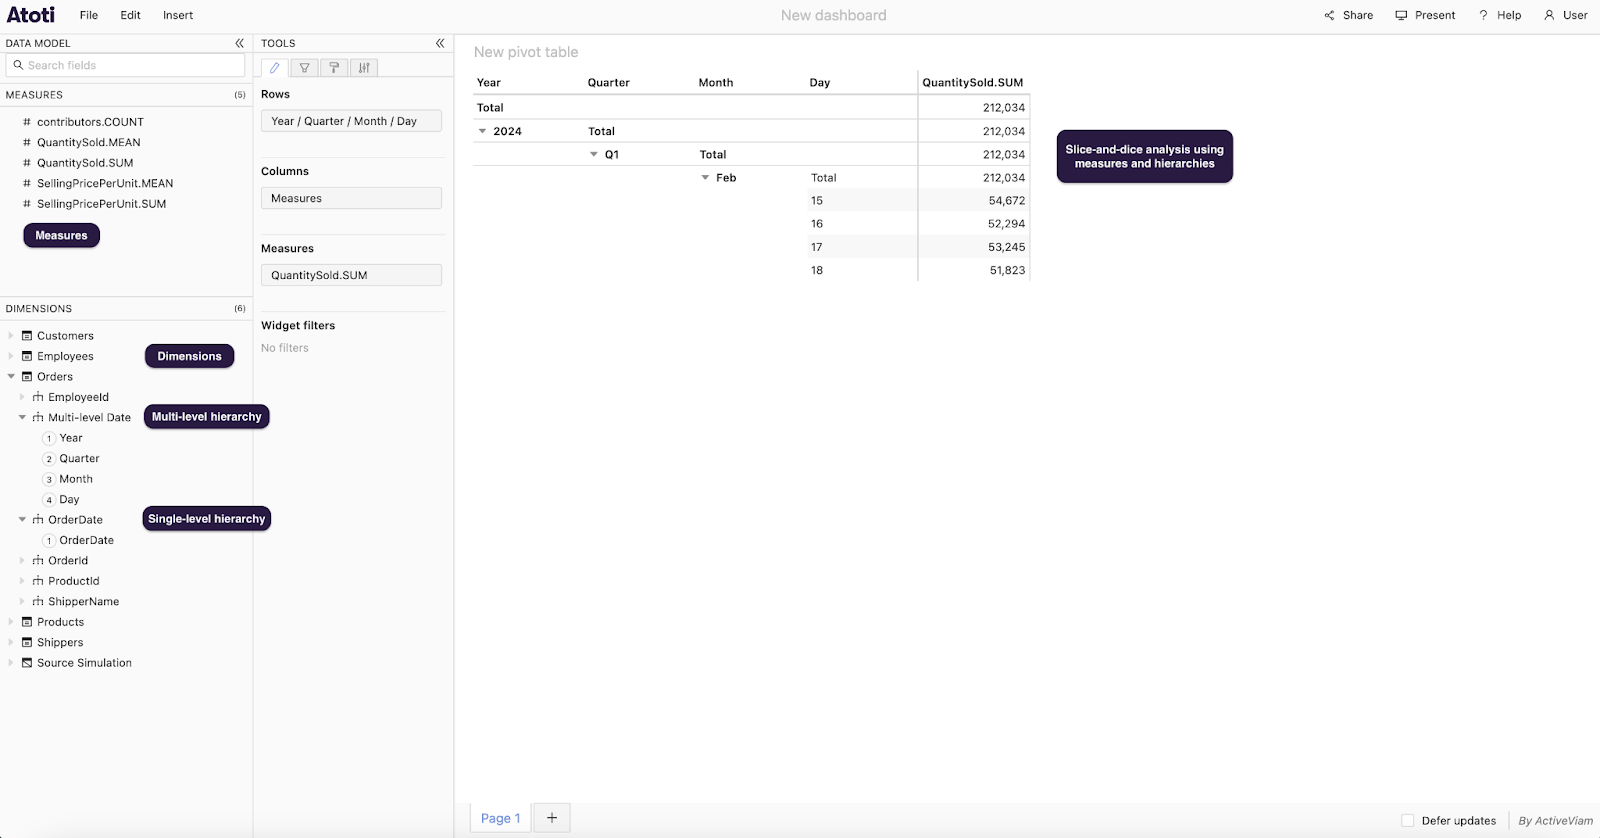
- Measures: Represents the numeric data that we want to aggregate, such as the SUM or MEAN of a QuantitySold column, slice-and-diced by selected hierarchies. For example, we could slice the QuantitySold.SUM measure by the multi-level OrderDate hierarchy to represent the aggregated number of sold items for each Year, Quarter, Month, Day, and so on, which should roll-up to the total for the QuantitySold.SUM measure.
💡Note: For instructional purposes, we’ve turned off the default option for viewing a Simplified data model below to explicitly show the hierarchies categorized by their dimensions in the bottom-left pane of the Atoti UI. To do this, you can go to User > Settings > and toggle the Simplified data model option off.
Great, now that you’re familiar with hierarchies and OLAP cubes, let’s dive into hierarchy fundamentals in Atoti!
💡Note: For this walk through, check out the Hierarchies notebook to follow along!

Setting Up the Cube
In order for us to walk through creating and manipulating hierarchies, we’ll need to set up the Atoti cube data model and populate the cube with data that we can use.

Let’s first import our libraries.
import atoti as tt
import pandas
Then, we can spin up the Atoti server and link the session to our web-based Atoti UI. Here we define a file storage location to persist any dashboards that we create in the Atoti UI, specify the port for the session (9092), and set minimum (1GB) and maximum (10GB) on-heap memory allocations.
session = tt.Session(
    user_content_storage="./content",
    port=9092,
    java_options=["-Xms1G", "-Xmx10G"],
)
session.link
With the session up and running, we can now create Atoti tables and populate them with data. We will be populating the following tables/dimensions:
- Orders
- Products
- Shippers
- Customers
- Employees
For example, we can use the read_csv() function to simultaneously read in a CSV file from an S3 bucket and create an Atoti table object with explicitly defined data types and keys for its underlying columns. In Atoti, measures are automatically created from inherently numeric columns (such as an OrderId), which is why we must set these columns as strings if the intent is to use these as hierarchies instead of measures (there is no point in aggregating an OrderId). Lastly, we also set the OrderDate field as a LOCAL_DATE data type with a defined date pattern so that Atoti knows how to parse the date values, which we will use later to define a multi-level date hierarchy.
💡Note: Check out the table creation and data loading starter guide for more information on creating tables and loading data in Atoti!
orders = session.read_csv(
    "s3://data.atoti.io/notebooks/hierarchies/data/Orders.csv",
    types={
        "OrderId": tt.STRING,
        "OrderDate": tt.LOCAL_DATE,
        "ProductId": tt.STRING,
        "EmployeeId": tt.STRING,
        "CustomerId": tt.STRING,
    },
    date_patterns={"OrderDate": "dd/M/yyyy"},
    keys=["OrderId"],
)
Once we’ve created and populated the tables, we can join our Atoti tables together using common keys and create the cube.
# Join tables
orders.join(products, orders["ProductId"] == products["ProductId"])
orders.join(employees, orders["EmployeeId"] == employees["EmployeeId"])
orders.join(customers, orders["CustomerId"] == customers["CustomerId"])
orders.join(shippers, orders["ShipperName"] == shippers["ShipperName"])

# Create Cube from Atoti Table object
cube = session.create_cube(orders)
Calling the session.tables.schema property will visualize the schema of the cube data model.
# View the schema of the data model
session.tables.schema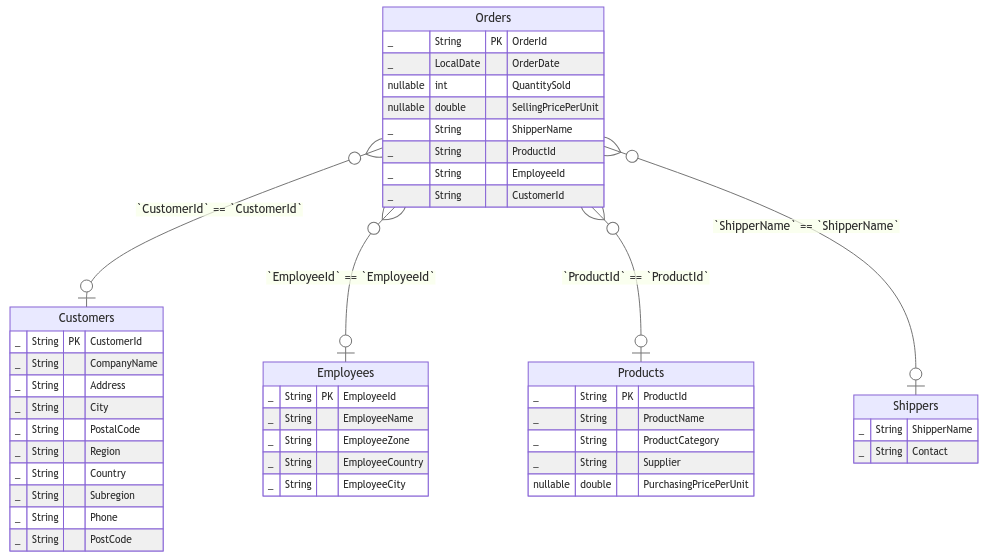
Hierarchy Basics
Now that our cube is set up and populated with data, let’s review a few hierarchy basics. First, a good practice is to alias our hierarchies, levels, and measures as new variables for enhanced readability when manipulating these components of the cube, like so:
# Set variables for hierarchies, levels, and measures
h, l, m = cube.hierarchies, cube.levels, cube.measures
Let’s view the full list of hierarchies for the cube, categorized by dimensions and the associated levels for each hierarchy (starting with a 0-based index) using the alias.
h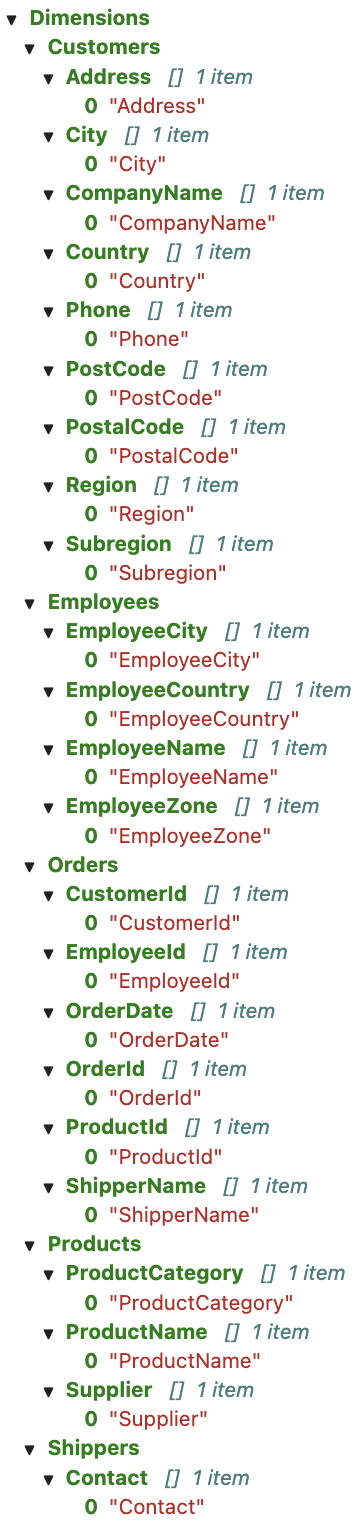
Now that we’re aware of our hierarchies, if we wanted to now use one of these hierarchies and select a measure to view numerical metrics, we can select the ProductId hierarchy with the QuantitySold.SUM measure to view the granular breakdown of total number of products sold.
💡 Note: We can use either session.link to perform this analysis within the Atoti UI or session.widget to analyze directly within the Jupyter notebook using the Atoti JupyterLab extension.

Or, if we want to further slice-and-dice, we can simply add another hierarchy (CustomerId) to the mix, which will dynamically adjust the pivot table to allow for a more granular breakdown of the total number of items sold per product and customer.

Multi-Level Hierarchies
Previously, we mentioned single-level hierarchies and multi-level hierarchies. Single-level hierarchies are created by default (specifically if you create your cube in auto or no_measures mode), and usually map one-to-one to the columns of an Atoti table; however, if a parent-child relationship exists, we may want to logically group associated levels together to reflect such a relationship. This is the basis for multi-level hierarchies. For example, there is a parent-child relationship between our ProductCategory (parent) and ProductId (child) hierarchies, as each individual product falls within the umbrella of a higher-level product category. If we create a multi-level Product hierarchy, like so:
h["Product"] = [l["ProductCategory"], l["ProductId"]]What we’ll now see either in the Atoti UI or Atoti JupyterLab extension, is a hierarchy with a drop-down illustrating this parent-child relationship.

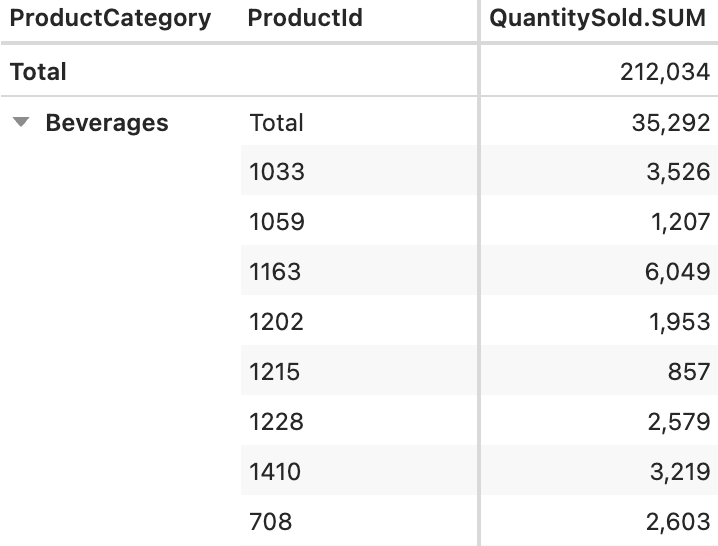
And if we now use the Product hierarchy in our analysis, we get a breakdown of our data for QuantitySold.SUM by associated product categories and product IDs.
Common Case: Multi-Level Date Hierarchies
One of the most common use cases for creating multi-level hierarchies is when dealing with dates. For example, perhaps we want to have a multi-level OrderDate hierarchy that shows the breakdown for each corresponding year, quarter, month, day, and so on.
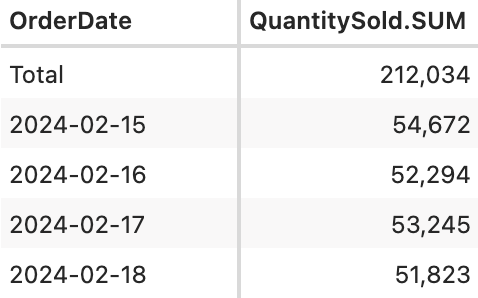
As of right now, our single-level OrderDate hierarchy can only drill-down to the fully qualified date as shown.
But if we create a multi-level OrderDate hierarchy, we can show the breakdown for each corresponding year, quarter, month, and day.
💡 Note: Check out our documentation for more information on using the create_date_hierarchy function.
# Create a multi-level date hierarchy
cube.create_date_hierarchy(
    "Multi-level Date",
    column=orders["OrderDate"],
    levels={"Year": "yyyy", "Quarter": "QQQ", "Month": "MMM", "Day": "dd"},
)
Final Thoughts
Try the included notebook to further slice-and-dice various hierarchies and measures and play around with the data! Or even better, use it as a template to insert your own data for your own insights! We hope this walk through gives you a jump start for working with hierarchies in Atoti 😊. And If you have any questions or feedback, we’d love to hear from you! Stay tuned for more advanced topics on Atoti hierarchies in the future, and until then, take care! 👋