Interview with Dalcon Hai – Senior Business Analyst
- Atoti team: Could you tell us a bit more about you and your team?
Dalcon Hai: I am the senior business analyst within market risk technology at Standard Chartered Bank and we’re building a strategic market risk platform for the bank. It’s a cross-asset platform and will essentially replace our existing legacy systems and bring the bank up to speed with the latest in-memory OLAP technology from ActiveViam [the makers of Atoti].
- What is Stressed VaR calibration and how often do you run this process?
VaR is “Value at Risk”, it’s a common way to measure risk in finance. Stressed VaR calibration is a regulatory requirement from the PRA (Prudential Regulation Authority). It applies to all banks that have been approved for IMA, known as the internal modelling approach, to calculate and manage trading book risk.
From the bank perspective we need to run VaR calculations on our trading books. However, the regulator also wants to run our VaR model against a period of stress in the markets.
We are required to demonstrate to the regulator that we have looked at the period of stress from 2007 right up until now. We run the VaR based on a historical simulation VaR, looking at the market risk, at the shocks in the market risk factors against our current trading book and we check whether our model’s predictions match the historical reality.
We take a quarterly cut of our books and positions, and then run VaR historical simulation against it. We look at this from 2007 to 2020 periods and we need to calculate the PnLs against every historical date, simulating the market stresses. When we do that, the most significant period of stress tends to be the same for most banks: the Great Financial Crisis, ie. the period during Lehman Brothers went bankrupt.
But we have to continue doing this exercise because anything can happen going forward, for example, the current COVID-19 pandemic. We saw a lot of stress happening in the markets during March, and it came at a time where we had to do this calibration and check if we were experiencing a new stress period. Do we now need to take into consideration the period from 2020 March as the new stressed period of reference? We have to go through this exercise and churn out a huge amount of data, involving many teams to run this historical simulation on the books for this 13 year period.
- What kind of insights does it provide you?
Once we identify our stress period, we use it to calculate Stress VaR. If the stress period after the calibration exercise changes and the new stress period is COVID-19 (2019 to 2020), then we have to update our daily Stress VaR calculation. That affects our regulatory capital as well because, according to Basel banking regulatory guidelines (and eventually “FRTB”, the future regulatory framework for finance), we need to calculate our regulatory capital, in terms of risk-weighted assets, based on the stressed VaR.
- How long does it take for you to complete the calibration?
It takes a while because there are a lot of moving parts and it’s not easy. We have to first get all the positions of our books, all the risk factors and trades, and then we have to price them. Then we have to get the outputs for that pricing and run aggregation on top of it. Then we have to run sanity checks — checking the data to make sure it’s correct before we can do the calibration. Even if we find a new peak, there’s a lot of discussion and senior management needs to approve that this is a new stress period. But since I’ve come along in this journey, there hasn’t been a change in the period — The stress period 2007- 2008 has consistently been the period that has been the peak every time. We don’t know if that’s going to change. We’ll see.
- What are the challenges associated with VaR calibration?
We had per year P&L data from 2007 to 2019 but it was difficult for me to create this kind of rolling VaR period. What I mean by rolling VaR period is this: I had a 3200 vector if I looked across a 12-year period, but what I needed to do was actually calculate VaR on the sub-array of that vector. I needed to take a 260 array and I needed to slide that 260 window across from 2007 to 2019, calculate the VaR on that (the 260 window) and get my new VaR. Basically look at the chart and see if this period is the new peak.
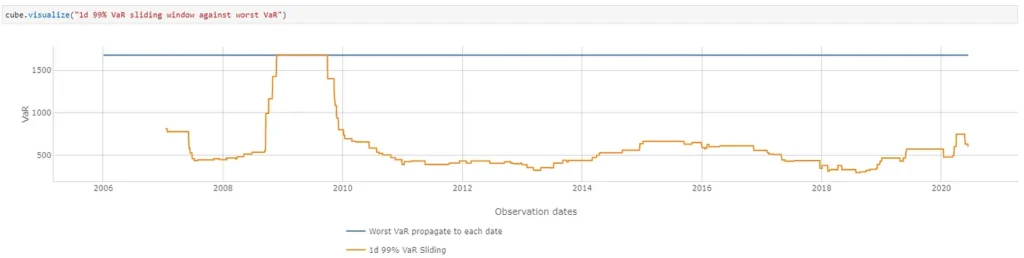
Caption: Visualization used for Stressed VaR Calibration
- How has Atoti changed your process?
In the beginning, our end users from the Market Risk department were using Excel to aggregate, which was very, very painful. We were extracting data at portfolio level from the legacy risk system and would only get portfolio and P&L vectors with no breakdown. We had 12 massive files and had to aggregate all that in Excel.
What I was able to do with Atoti is actually get high volume, granular data, broken down, basically to product, currency and instrument level data. We didn’t have trade level data yet because we hadn’t adopted the new strategic risk engine. But that was far better than what we previously had, it was a lot more granular and that’s all we needed. With Atoti, we load that data into the cube and we get an aggregated view of the business line group level, like commodities or xVA. We can now look at what’s driving the VaR for each business line, drill down into it to the instrument level and see which one is driving the tail. This is something that we never had before.
That’s why Atoti, at that point in time, was perfect for this use case. First of all, we wouldn’t be able to plug that much data into the production environment: it just wouldn’t work as it would affect our production sign-off. But with Atoti, we could spin off of a cube that doesn’t necessarily need to interfere with Production: i.e. run in a UAT environment, generate the extracts, spin up a cube and then, basically, perform the analysis that we needed for the calibration.
It saved us a lot of time and it helped us investigate a particular issue we had as well. When we get 12 years of data, we’re bound to get some erroneous data. We had some erroneous market input data that we couldn’t pinpoint. For example, there was a spike that happened in 2016. Why is this spike happening in this period? It’s always been 2008 and 2009. So when we actually drill down to the particular business area, and to the particular currency, we found that there were actually issues in some of the market data during that period. We were able to quickly identify that and sort it out. If we didn’t (drill down), we couldn’t identify it and there will be a lot of questions raised as to why the Bank is now looking at 2016 when everyone else is looking at 2008 and 2009.
- What value did Atoti bring to your business?
Before we had a legacy risk system, which is just an Oracle database and it didn’t give us all the granularity. It just aggregated at portfolio level. We hadn’t fully adopted the new strategic risk engine yet. We couldn’t pipe market data to the market risk cube. We had this transition period where we have to decide how we are going to do this. Atoti worked out well for us as a POC, filling a gap that we needed.
- How was your experience with Atoti?
I think the whole experience has been very positive. We were very early adopters, and were pretty much trying it out on Day 1. We had people from the Atoti dev team coming over and they gave a presentation. At some point, I also joined a chat group as well. I was very involved in that kind of early adopter stage of it. Obviously the product continues to evolve and becomes a lot better. So I think it’s been really good. ActiveViam has really supported us and some of their employees have been really helpful for me, coming to London and helping me out on this specific use case. It’s been very, very positive.
- Are there any other use cases you see as potential good fits for Atoti?
I think it’s good for offline analysis. It’s good for doing prototypes for BAs (business analysts) especially. It’s much better to actually use a Python notebook, show it to a developer and tell them what needs to be implemented.

Dalcon Hai is a senior business analyst at SCB and built the Stressed VaR calibration solution with Atoti.