

Interactive decomposition with Atoti
This article is the second part of a series of tutorials about interactive analytics in in Atoti’s dynamic pivot tables. Check out Part 1: Pro-rata allocation. You may jump to “Solution #2” if you already know about non-additive measures.
What are non-additive measures?
We live in a complex world and often need to look at things from the bird-eye view to see the overall perspective. Say, we want to know the number of calories consumed during a day or total revenue of our e-commerce business.
Looking at the system from the bird-eye view means aggregating many contributing factors into summary measures. Oftentimes these aggregations are straightforward such as count or sum — we call them additive aggregations, but in certain cases aggregations are complex and things just don’t add up easily. In this case, we say aggregations are non-additive. A number of distinct items purchased in retail stores is a good example of a non-additive measure: when you break it down, say, by store name or by the city — the top-level value will not be equal to the sum of contributors.
Explaining non-additive measures: Atoti to the rescue
Calculating non-linear aggregations is often an expensive and hard task, but what is even harder is to be able to dynamically explore and explain how this aggregation is driven by underlying contributors. This problem is called contribution analysis. A typical example would be:
- Allocating firm-wide economic capital down to trading desks,
- Line-by-line surplus requirements for insurance companies,
- Dynamic resource allocation.
In this post we will see how “parent” and “sibling” data relationships in Atoti allow you to easily navigate any hierarchy of data and implement your on-the-fly allocation rules. I will be using examples from the risk management in finance, as the calculations are often non-additive — think about Value-at-Risk, FRTB, EAD and others.
Solution #2: Incremental contribution
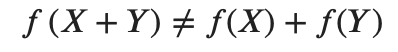
In the previous post we were decomposing a non-additive measure into additive components. There’s another perspective on the contribution analysis when you don’t want to allocate the top-level number down to additive components, but you want to evaluate incremental, aka marginal impact of a contributor — computing the impact of a scenario if that contributor is hypothetically removed:

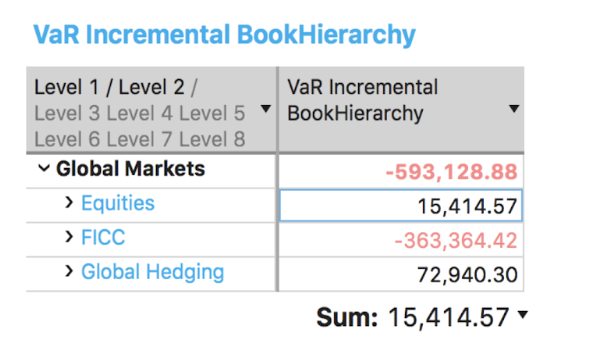
In the following example, the “VaR Incremental BookHierarchy” measure shows the impact of the sub-portfolios on the firm-level VaR “as if the portfolio was removed”. For example, for the business line “Equities” it is +15.414, meaning that this portfolio has a positive +15.414 impact on the firm-level VaR.
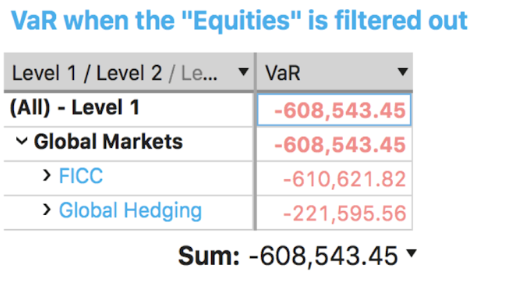
To test that, let’s visualize the plain version of the “VaR” measure — not the incremental one. If we filter out the “Equities” and compute the “VaR” it goes from -593,129 to -608,543 which is exactly 15.414 lower (-593k — (-609k))!
To implement this behavior in Atoti, we will use exclude_self=True parameter of the siblings aggregation. The following measure will aggregate positions being “siblings” of a sub-portfolio, and will ignore positions belonging to the current sub-portfolio:
m["Excluding Self"] = Atoti.agg.sum(
    m["Position Vector"],
    scope=atoti.scope.siblings(h["Trading Book Hierarchy"], exclude_self=True),
)
Now let’s compute VaR from the sibling’s aggregation:
m["Parent VaR Ex"] = Atoti.array.quantile(
    m["Excluding Self"], m["Confidence Level"]
)
To finalize the incremental calculation, we’ll compute VaR above the current book and subtract the calculation excluding current sub-portfolio
m["Parent VaR"] = Atoti.parent_value(m["VaR"], h["Trading Book Hierarchy"])
m["VaR Incremental Book Hierarchy"] = m["Parent VaR"] - m["Parent VaR Ex"]
You can find a notebook implementing this example in the Atoti gallery: Value at Risk: A simple way to monitor market risk with Atoti.
Conclusion
In this post, we discussed how to use parent and sibling relationships in Atoti to implement contributory measures and explain non-additive measures. I hope the described techniques can help you build powerful analytic applications!

