Has Video Assistant Referee impacted the Premier league standings?
There has been much debate about the video assistant referee (VAR) in association football when it was introduced last year (in 2019). The goal is to lead to fairer refereeing, but concerns are high: will this really turn out to be the case and won’t it break the rhythm of the game?
We will let the sports analysts answer that question. But one thing we can look at is how VAR has impacted the league so far.
Let’s perform some data analysis with the data containing all the premier league goals of the 2019/2020 season. Using the Python library Atoti, we will compute the Premier League standings and simulate a number of scenarios:
- What would happen to the Premier League standings if VAR-cancelled goals were still counted?
- Would the Premier League standings change if we use the scoring system that was common before the 1990’s, where only 2 points were awarded to the winner?
- Would Leicester reach the bottom of the standings if Vardy had not scored?
2019/2020 Premier League Data
We used is composed of events. An event can be anything that happens in a game: kick-off, goal, foul, etc.
For the purpose of this example, we only kept events with EventType Goal or Kick-Off:

Analysing data in Python
We import the data and create a multi-dimensional cube using Atoti in a Jupyter notebook:
import Atoti as tt

session = tt.create_session()

events_store = session.read_csv(
    "s3://data.Atoti.io/notebooks/premier-league/events.csv",
    sep=";",
    store_name="events_store",
)

cube = session.create_cube(events_store)
And we are ready to start our Premier League analysis!
Computing the EPL Team score of each premier league match
We start our analysis by first computing the score of each football team for a particular match in the Premier League season. From there we were later able to calculate how many points each team had won for each day of the season and then compute the goal rankings.
For that, we create a measure that counts the number of events of EventType Goal. Then we can aggregate this count for any particular match and team in the Premier League season.
m["Team Goals (including Own Goals)"] = tt.agg.sum(
    tt.where(
        lvl["EventType"] == "Goal", tt.agg.count_distinct(events_store["EventId"]), 0.0
    ),
    scope=tt.scope.origin("EventType"),
)
As the name of the measure suggests, this measure also counts goals that have been scored by players, but against their team. Those goal events are flagged with IsOwnGoal = True. We are then able to create a measure to exclude them:
m["Team Own Goals"] = tt.agg.sum(
    tt.where(lvl["IsOwnGoal"] == True, m["Team Goals (including Own Goals)"], 0.0),
    scope=tt.scope.origin("IsOwnGoal"),
)
And we can compute the real goals that were scored for the team by doing the difference between the last two measures:
m["Team Goals"] = m["Team Goals (including Own Goals)"] - m["Team Own Goals"]
Visualizing Team Goals
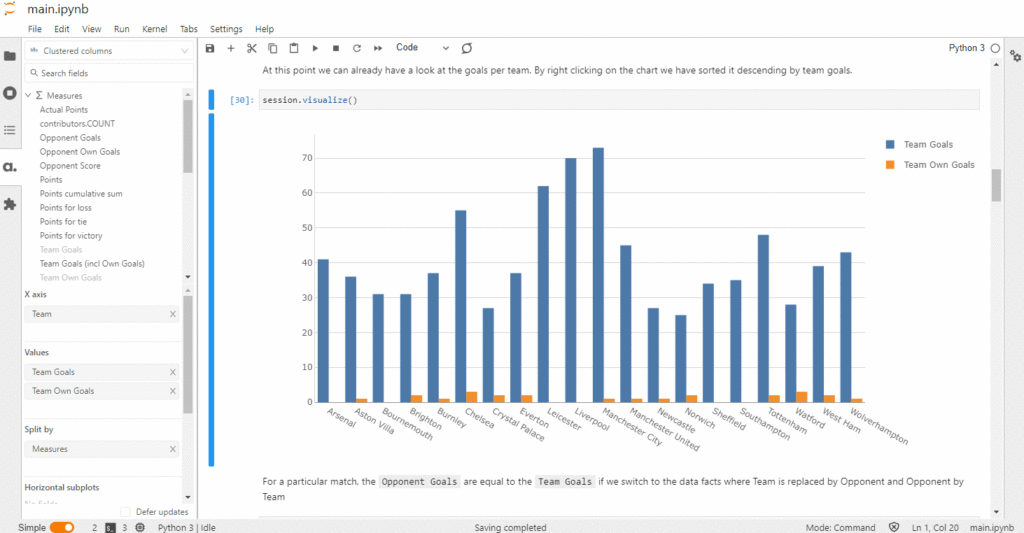
We can quickly generate a data visualization in the Jupyter notebook using session.visualize(). Let’s have a look at the total goals for the Premier League season by each football team:

It is easy to toggle the data visualization from a chart into a pivot table and drill down on days. Let’s see how many goals a team has scored on each day of the Premier League season:

To compute team scores, we also have to calculate the opponent’s goals and the opponent’s own goals for each football team. In order to do that, we will simply re-use the measures we previously created and define a new one that retrieves the Team Goals of the opponent:
m["Opponent Goals"] = tt.agg.sum(
    tt.at(
        m["Team Goals"], {lvl["Team"]: lvl["Opponent"], lvl["Opponent"]: lvl["Team"]},
    ),
    scope=tt.scope.origin("Team", "Opponent"),
)
And do the same for the opponent’s own goals.
The score of a team is then equal to the Team goals plus the opponent own goals:
m["Team Score"] = m["Team Goals"] + m["Opponent Own Goals"]
And the opponent score is the opponent goals plus the team own goals:
m["Opponent Score"] = m["Opponent Goals"] + m["Team Own Goals"]
We can now have a look at the results of each game in another pivot table:

Now if we were to compare these results with the actual Premier League scores, they would be different. This is because the events also include goals that were later cancelled by the VAR. To get the actual results, we simply filtered on IsCancelledAfterVAR = False:

Computing the Premier League standings
Now that we have the score of each game for the Premier League season, we can compute the rankings.
Following the current FIFA World Cup points system, we assign three points for a win, one for a draw and none for a loss:
m["Points for victory"] = 3.0
m["Points for tie"] = 1.0
m["Points for loss"] = 0.0
To compute the points won by the team, we can aggregate the points for victory. This is on the condition that the team score is higher than the opponent score at match level. League, Day and Team are the keys for a particular match.
m["Points"] = tt.agg.sum(
    tt.where(
        m["Team Score"] > m["Opponent Score"],
        m["Points for victory"],
        tt.where(
            m["Team Score"] == m["Opponent Score"],
            m["Points for tie"],
            m["Points for loss"],
        ),
    ),
    scope=tt.scope.origin("League", "Day", "Team"),
)
The computed Points includes VAR-cancelled goals. We need to define another measure to remove the points for these goals and retrieve the actual points:
m["Actual Points"] = tt.filter(m["Points"], lvl["IsCancelledAfterVAR"] == False)
And we can now have a look at how VAR impacted the Premier League standings, especially those highlighted in red suffered because of the point cancellation:

More than half of the teams have had their points total impacted by VAR either positively or negatively.
Though it does not impact the top EPL teams, it definitely has an impact on the ranking of many teams. If the VAR had not cancelled any goal, Manchester United would have lost 2 positions and Tottenham 5!
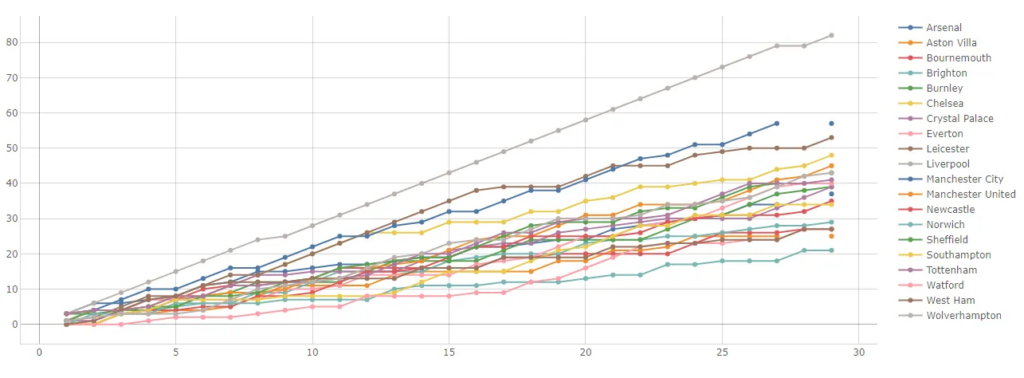
If we look at the evolution of the points throughout the Premier League season, we can quite well understand why Liverpool was not impacted by VAR.
m["Points cumulative sum"] = tt.agg.sum(
    m["Actual Points"], scope=tt.scope.cumulative(lvl["Day"])
)
They are simply flying over the whole championship.
Simulation of a different scoring system
Although we are all used to a scoring system giving 3 points for a victory, 1 for a tie and 0 per lost match, this was not always the case. Before the 1990’s, many European leagues only gave 2 points per victory. The reason for the change is to encourage teams to score more goals during the games.
The premier league gifts us well with plenty of goals scored (take it from someone watching the French Ligue 1), but how different would the results be with the old scoring system?
Atoti enables us to evaluate this what-if scenario very easily.
We just have to set up a simulation on the Point for victory measure and create a new scenario where we give it another value:
scoring_system_simulation = cube.setup_simulation(
    "Scoring system simulations",
    replace=[m["Points for victory"]],
    base_scenario="Current System",
)

scoring_system_simulation.scenarios["Old system"] = 2.0
And that’s it, no need to define anything else, all the measures will be re-computed on the fly with the new value in the new scenario. We can now compare the scenario against the original points in the data visualization:

Surprisingly, having only 2 points for a win would only have Burnley and West Ham lose 2 ranks, but no other real impact on the Premier League standings. This can be seen more clearly in the chart below:

If you wish to explore the data used in this article or see the simulations live, you can have a look at our notebook on this topic.


