

Having been inspired by the article Data Table using Data from Reddit, I was convinced that I could do much more with Atoti. Now, I have finally arrived at the last part of my trilogy! If you haven’t seen the first 2 articles, you can check these out:
In this article, I’m going to create a multidimensional data cube out of Reddit data and create a “real-time” monitoring dashboard with Atoti. Check out the complete notebook in Atoti’s notebook gallery for more details.
Before going into the details of implementation and just to quickly compare against the Dash data table presented in the article mentioned above, the below GIFs showed how easily I can create and manipulate data in Atoti pivot tables.

Atoti’s in-memory multidimensional data cube
Below is a quick summary of how to create an Atoti data cube:
- Create Atoti session
- Read datasource into Atoti datastore
- Join the datastores if there are more than one
- Create data cube with a base datastore
Check out Atoti’s documentation for more details on how to create the Atoti session.
Reddit Posts datastore
Atoti supports a variety of datasource types. Since I stored the subreddits’ posting in a Pandas DataFrame, I can load the DataFrame “df” into Atoti datastore named “Reddit Posts” as follows:
reddit_store = session.read_pandas(df, keys=['id'],
                                   store_name='Reddit Posts')
reddit_store.head(3)
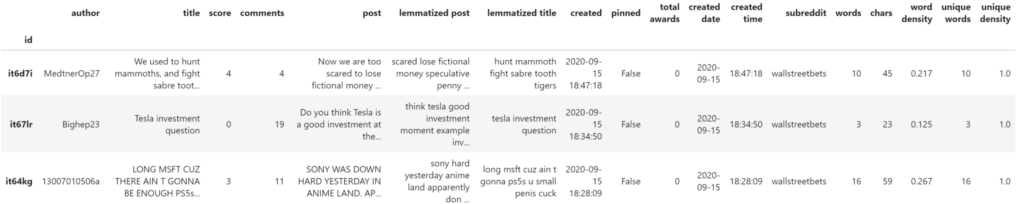
Using the subreddit’s unique submission id as the key, I can ensure that the incremental data loading from subsequent pollings is unique. Atoti automatically performs an update if the “id” of the incoming data already exists, otherwise insert it as a new record.
Once I have created the datastore, I can trigger the incremental data loading as follows whenever I have incoming data:
reddit_store.load_pandas(df_news)
Extracted Named Entities datastore
While I used “load_pandas” to trigger data loading as a means to achieve real-time behavior, I’m using the “watch” feature of “Atoti.read_csv” for the NLP data:
entity_store = session.read_csv(
    "entities.csv",
    keys=["id", "category", "text"],
    store_name="Entities",
    watch=True,
    sep="|",
)
By turning on the “watch” function, any updates to the source file will trigger an update into the datastore. This is convenient for me as I can simply write the NLP results into the CSV file without having to maintain multiple objects from the posts iterations.
Reddit data cube creation
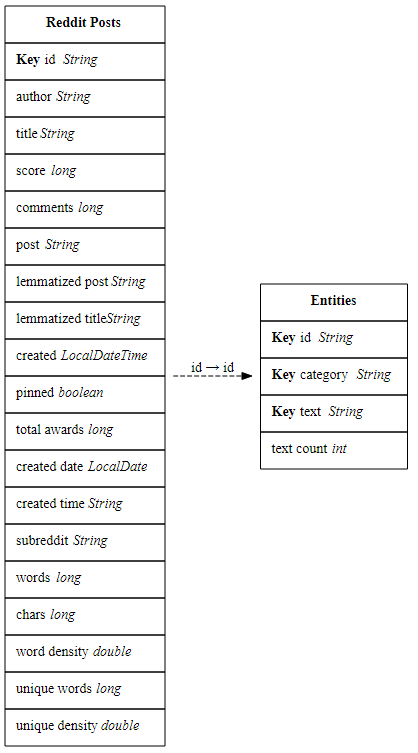
I have 2 datastores — Reddit Posts and Entities. I relate the two datastores with a join as follows:
reddit_store.join(entity_store)
If you imagine joining two tables in a database, one would have to indicate the keys for the join. What is nice about Atoti is that when no key mapping is defined, it automatically detects common columns in the two datastores and creates the join.
So, with Reddit Posts as the base datastore, I created the cube and view its schema as follows:
cube = session.create_cube(reddit_store, "Reddit", mode="no_measures")
cube.schema
Note that I can join a new datastore to the data cube at any time, not necessarily before the cube creation. The new datastore will be available immediately in the cube.
Measures creation
In this example, I created two simple measures:
- Number days — since I’m polling the latest 200 postings, depending on how active the subreddits are, the posts may spread over multiple days. This measure keeps track of the number of days the post is spread across.
- Cumulative Count — this measure allows me to see the trend of postings
Number days with count_distinct
m["Number days"] = tt.agg.count_distinct(reddit_store["created date"])
Just to demonstrate the beauty of a data cube and what the one-liner above can do:
Notice that the number of days is computed for any levels that I add to the pivot table. I only have to define the measure once and its value is computed on the fly as different dimensions are added.
Cumulative count
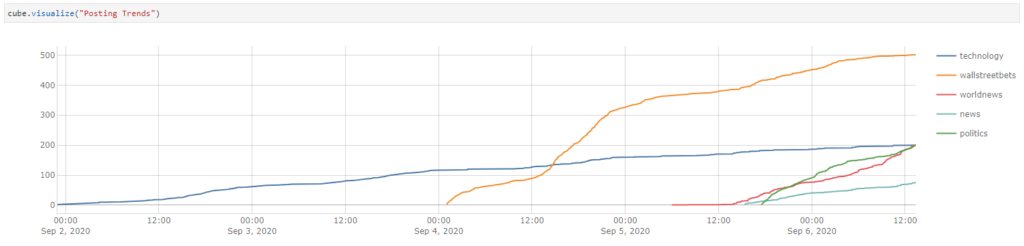
I can aggregate the number of postings incrementally by the day to observe the trends just by using the “cumulative” scope feature.
m["Cumulative Count"] = tt.agg.sum(
    m["contributors.COUNT"], scope=tt.scope.cumulative(l["created"], dense=True)
)
So now, I can plot the growth of each subreddits:
Dashboard building with Atoti
Using “cube.visualize”, I created data visualizations in Jupyter notebook while exploring my data. Instead of recreating them in my dashboard, I can publish them to the web application that comes with Atoti library:
Alternatively, run the below command to launch the web application to start building the dashboard.
Adding on to the dashboard created above, I can simply drag and drop any widgets into the dashboard.
Interactive dashboard with Quick Page Filters
The below example shows how I added the out-of-the-box Quick Page Filter to create an interactive dashboard.
By choosing the entity category “Person” and text “Donald”, I can see the trend of posts mentioning “Donald”.
Charts Manipulation
Check out the oddly satisfying charting experience with Atoti as the charts re-render when I change from one chart type to another.
Unhide the subplots controls from the ellipsis menu of the content editor. The chart quickly gets replotted as I drag the hierarchy “subreddit” from the “Slice by” to the “Horizontal subplots” section.
Applying filters to widgets
No matter the type of visualization, there are many different types of filters that I can apply. For instance, in the above example, I filter the charts to reflect the top 10 entities across the subreddits.
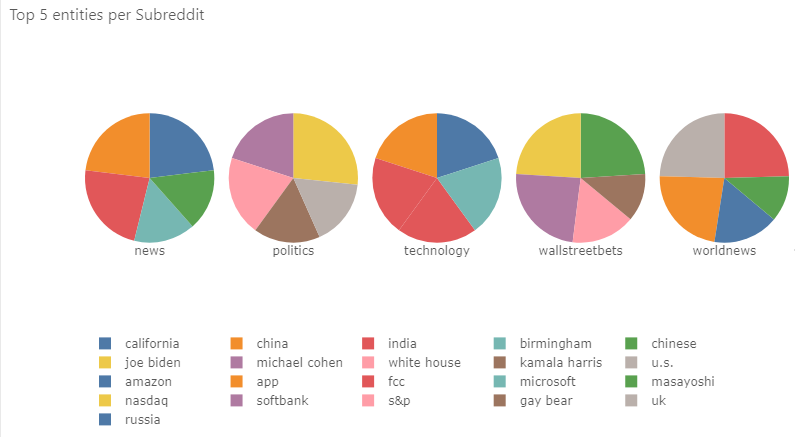
I can also achieve more advanced filtering using MultiDimensional eXpressions (MDX) manipulations. E.g.
SELECT
  GENERATE(
    [Hierarchies].[subreddit].[subreddit].Members,
    TOPCOUNT(
      [Hierarchies].[subreddit].CURRENTMEMBER * [Hierarchies].[text].[text].MEMBERS,
      5,
      [Measures].[contributors.COUNT]
    )
  ) ON rows,
  NON EMPTY [Measures].[contributors.COUNT] ON COLUMNS
  FROM [Reddit]
This would give me the top 5 entities per subreddit.
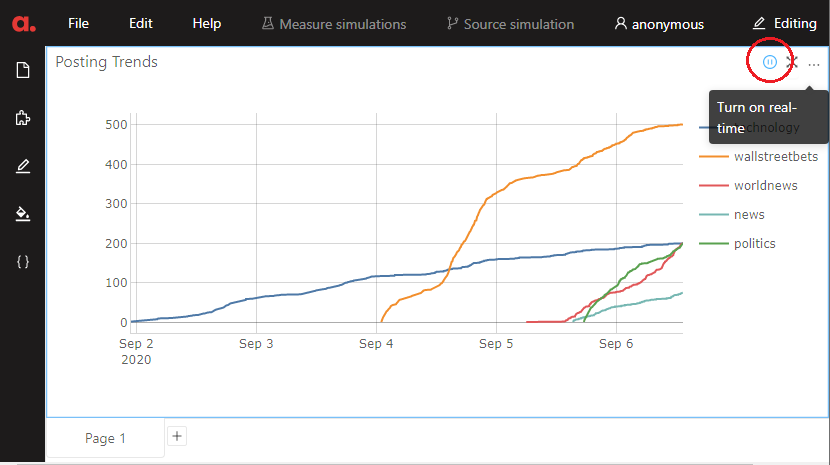
Real-time Dashboarding Analysis
To achieve real-time dashboarding, I toggle the query mode to turn on real-time using the icon below:
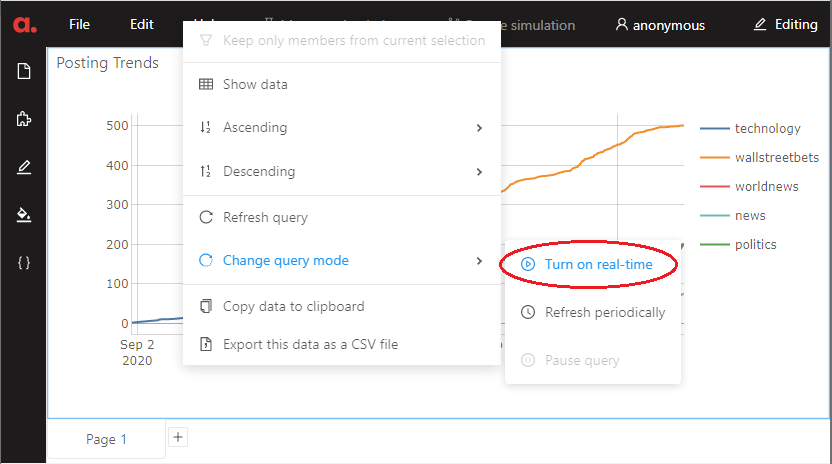
Likewise, you could right-click on the widget to change the mode from the context menu:
By using threading, I polled the subreddits every 30 seconds. See the dashboards refresh as the data comes in at different times:
Notice the green blinking cells? It shows that data is being refreshed with new updates. Can you see the difference in the number of activities in each subreddit?
On page 2 of my dashboard, I used a combination of quick page filters and conditional filtering to drill into the details of my NLP. Using a “label contains…” search on the keyword “Trump”, I can find all the postings related to Trump under the different subreddits.
Lastly, I looked at the posting trends of authors.
Notice in the GIF above, I did a drillthrough that allows me to see the underlying data of the selected cell in the pivot table.
To sum it all…
Things can definitely get more exciting than this. One can imagine adding sentiments of the posting into the story, and see how the community reacts to certain events or persons. There are also much more to the Atoti dashboards. Most important is your creativity in storytelling.
Download the notebook to see how everything is integrated together and have a try at expanding the story! But don’t forget to get your Reddit account for the API keys…

