Follow us as we will walk you through the process of creating, saving, sharing, and persisting dashboards in Atoti.
Would you like to create a business intelligence web application with Atoti?
Business intelligence tools are helpful to stay competitive. Organizations of every size and stage use BI tools to analyze, manage and visualize business data. It is extremely easy to create a business intelligence web application with Atoti.
Creating a session
First, let us create a session in Atoti, this session will give us a web application without any cube or any data loaded into it
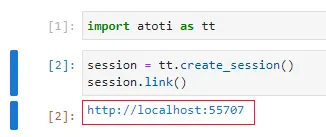
import Atoti as tt
session = tt.create_session()
session.link()
And after running the above, you will get a link to go to the web application.
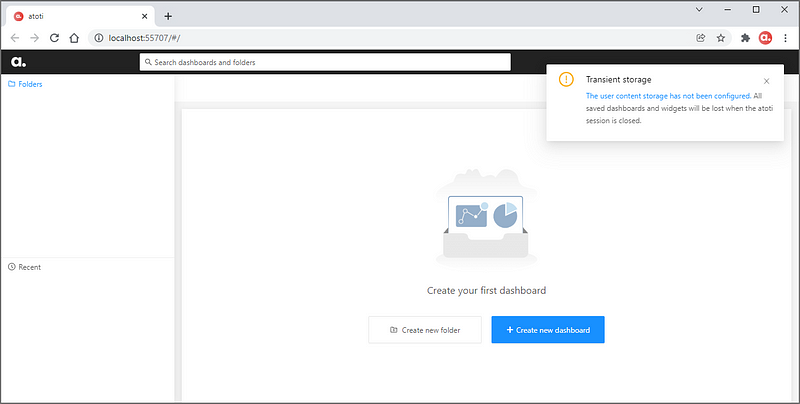
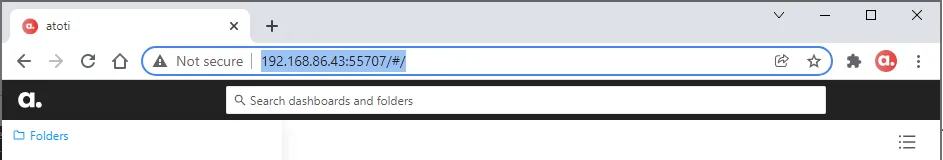
Initially, your web application will look something like this:
Getting the Atoti cube up and running
Before moving further, we need to now load the data into Atoti and create a cube. Here we will use a preprocessed version of Google Play Store Apps data from Kaggle to create a simple cube:
# loading the dataset
playstore = session.read_csv(
    "s3://data.Atoti.io/notebooks/topcount/googleplaystore_cleaned.csv",
    table_name="playstore",
    keys=["App", "Category", "Genres", "Current Ver"],
    types={"Reviews": tt.type.FLOAT, "Installs": tt.type.FLOAT},
)

# creating the cube
cube = session.create_cube(playstore, "Google Playstore")
I will now be able to access the cube from the web application. And this cube will be used for creating a dashboard.
Now you can choose the widgets of your choice and make the dashboard as per the KPIs required. Atoti enables you to determine the complexity of the dashboard based on your use case, there is no limit to the number of widgets you can have in the dashboard.
When you are happy with the dashboard, it is time to share it with other users!
Sharing the Atoti web application
Did you notice the web application is running on localhost?
For other users to access the web application, we will have to share the IP address of the machine where the notebook or Python script with Atoti is running- it could be your own laptop as well as a virtual machine running into the cloud.
To see the IP address of machine Atoti is deployed on:
For MacOS/Linux follow these steps:
- Open a Terminal app.
- Type /sbin/ifconfig this will list your IP address
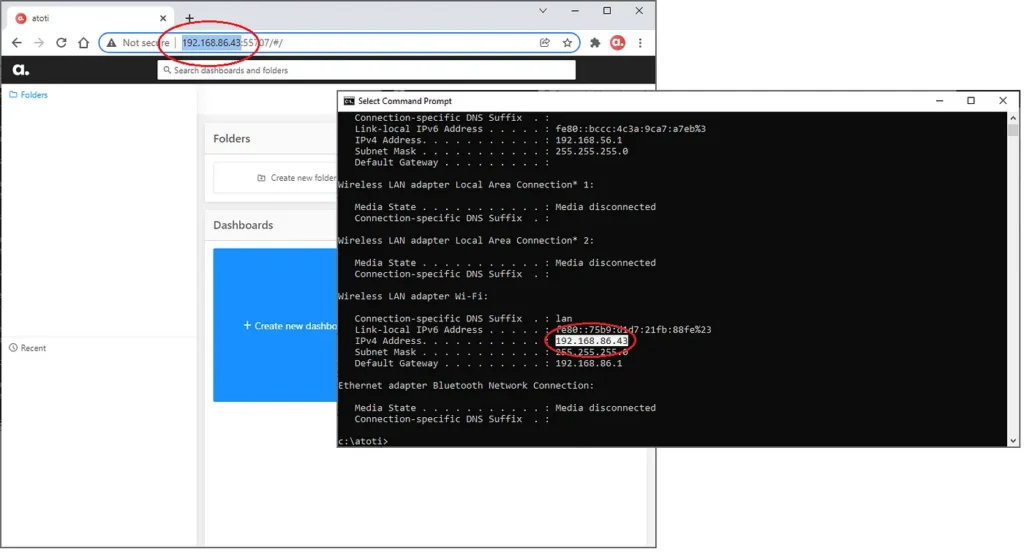
For Windows:
- Press Windows key. Start typing cmd and select Command Prompt from the menu.
- Type ipconfig and press Enter. This will display your IP address.
If you are working on your workstation like me, then your user might be on the same network as you.
You will need to manage the firewall access for your users, hence it is recommended to fix a port for the Atoti web application to run on.
You can do so by configuring the port as shown below:
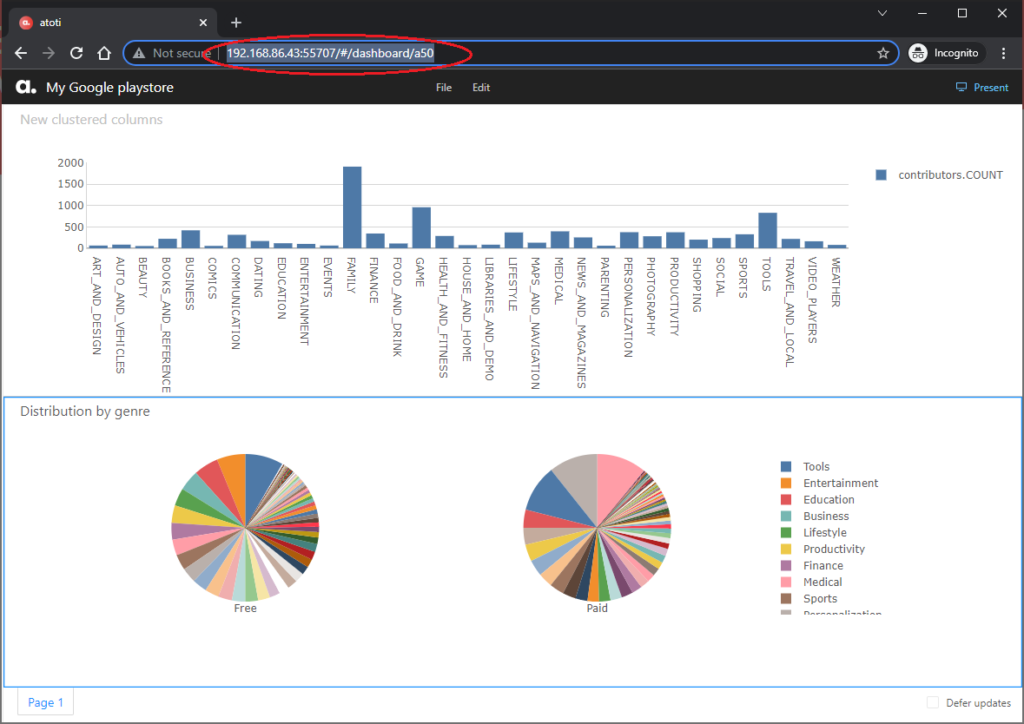
session = tt.create_session(config={"port": 55707})The Atoti web application is now accessible from the IP address at port 55707:
You can also run Atoti on a server or a cloud instance. Check out the below articles for cloud deployments:
Saving Atoti dashboards
During initial creation, the dashboard will be automatically saved when you give it a title. Your dashboard will be named “New dashboard” if you save without giving a title.
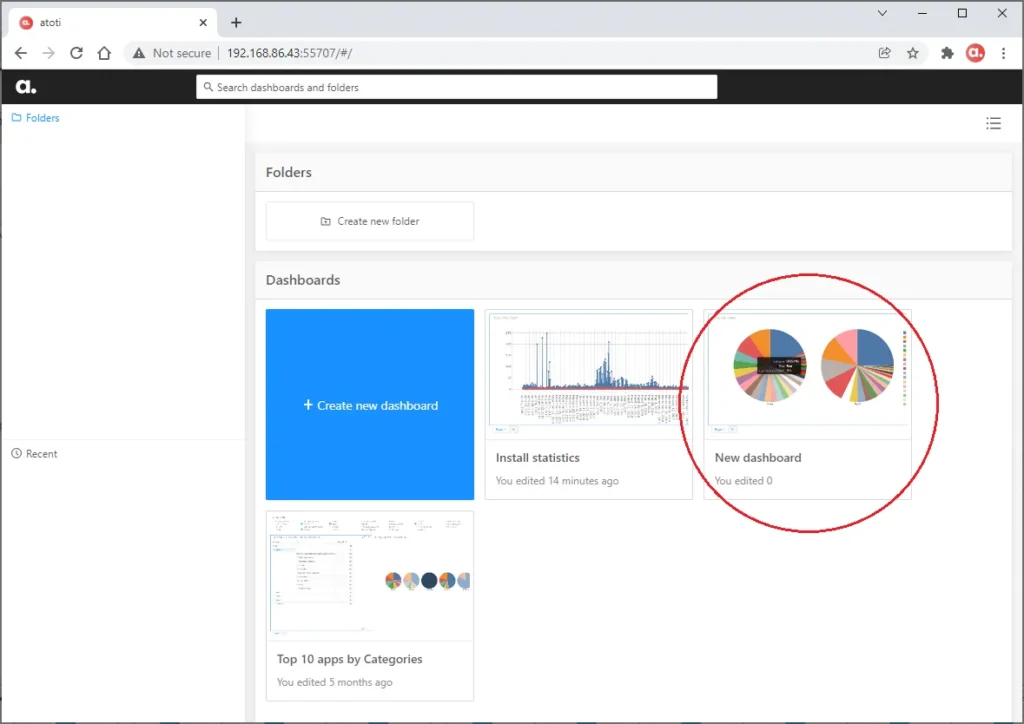
Alternatively, rename the dashboard’s title at the top right corner of the dashboard or use “Save” to give your dashboard a name.
Persisting a Dashboard
As of the current setup, you will lose the saved dashboards and widgets once the session is closed. To be able to save the dashboard and widgets and pick it from your left the last time, you need to persist your dashboards.
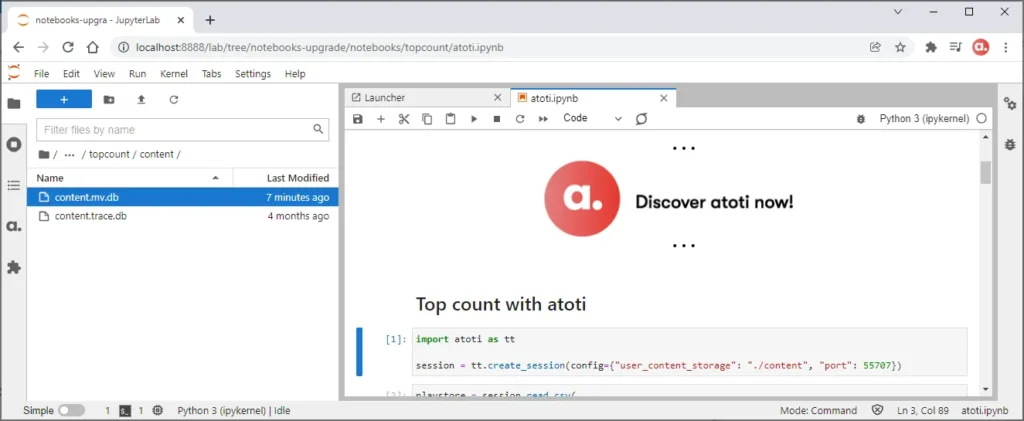
To persist Atoti dashboards, we need to set the user_content_storage parameter in the session configuration as follows:
session = tt.create_session(config={"user_content_storage": "./content", "port": 55707})This will create an H2 database under the folder “content”:
Sharing Atoti dashboards
Your users will be able to access the dashboards from the web application. However, if you would like to bring them to a specific dashboard, you can simply share its URL with the users.
Deleting a dashboard
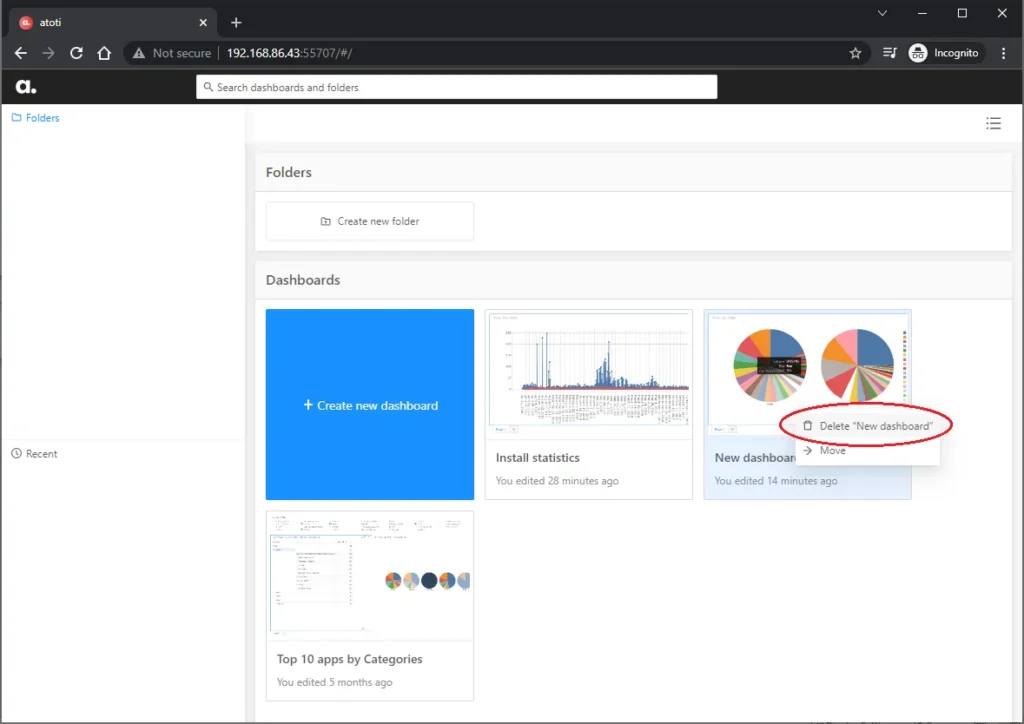
If you did not like a dashboard you created and would like to remove it, you can delete the dashboards.
Simply right-click on the dashboard to be deleted and select the delete option.
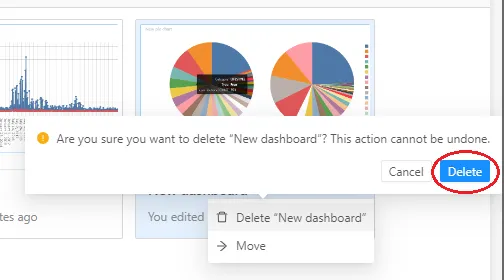
Click “Delete” on the message prompt.
Over to you
If you design some creative and useful dashboards and are proud of your creation, we would be very excited to hear about your success story!
Share it with us and stand a chance to get featured on the official Atoti LinkedIn, Medium, or Twitter channels.
The notebook used in this article can be found in the Atoti notebook gallery.
If you are still facing some issues with the Atoti dashboards, you can always reach out to the Atoti community on GitHub discussions or Github.