In this article, we will use the price elasticity of the demand-based model built with Atoti to construe the relation between the quote price and policy sale for automobile insurance policies.
Overview
Price elasticity is the key to understanding product demand and how consumers react to changes in market price.
Price elasticity can be seen across a wide plethora of domains from retail to insurance. Here we will build a predictive model on the quotes data from an automobile insurer to predict whether a customer will buy the insurance policy or not.
Then we will use Atoti to build a price elasticity of demand model on top of the predictive model to identify the different buckets of customers based on their price sensitivity. We will then create different what-if scenarios on the price and sales probability from the predictive model.
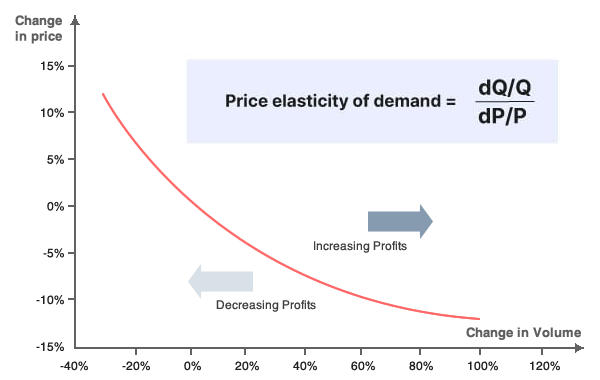
What is the price elasticity?
Price elasticity of demand is a simple measurement of the change in consumption of a product in relation to a change in its price.
In general, the availability of a substitute for a product affects its elasticity. If there are no good substitutes and the product is necessary, demand won’t change when the price goes up, making it inelastic.
- A good is elastic if a price change causes a substantial change in demand or supply.
- A good is inelastic if a price change does not cause demand or supply to change very much.
Cross Price Elasticity of Demand
The Cross Elasticity of Demand measures the response of the quantity demanded of a good when there is a price change of another good.
Cross price elasticity can measure either complementary products or substitute products. A negative cross-price elasticity means that the two products are substitutes for one another, and the increase in price for one would lead to higher consumer demand for the other.
Conversely, a product complement exists when the increase in the price of product #1 leads to a decrease in the demand for product #2, as the two products are used in conjunction with one another.
Cross price elasticity of demand can also be an interesting approach to study what happens when the competitors increase their quote price, but here we are not focussing on the probability of being affected by changes in other products.
Insurance Pricing explained
You can skip through this section if you already have some understanding of how insurance companies price their policies.
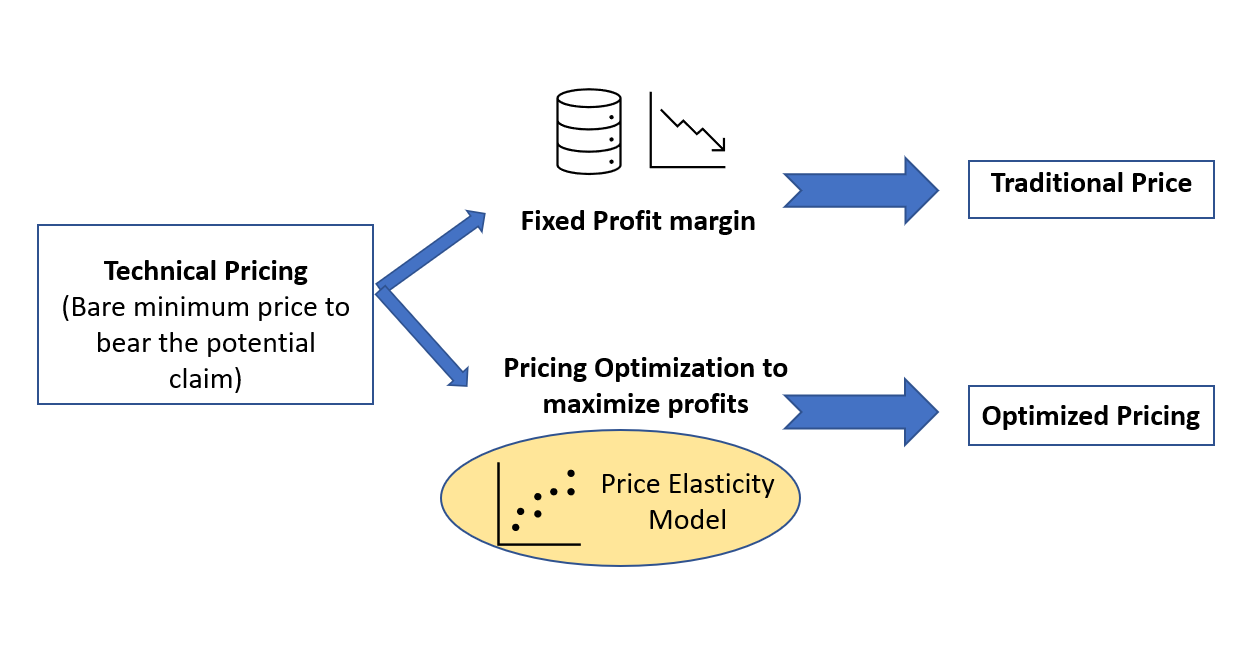
Every insurance company has two components of the quote price it gives to its customer for the insurance policy.
The first component is a technical premium, it is the bare minimum amount it needs to book to cover the cost of claims. Then there is another component the profit component, this is the part we will try to optimize using the price elasticity models.
Insurance Pricing is more complex than it seems
The inelasticity of customers can be attributed to the need of the customers and the urgency of buying a policy. For example, a policy that lapses tomorrow will be renewed by a customer with the company which issues the policy fastest, no matter what price we quote for the renewal.
The customer could also be inelastic for specialty lines, for example for a customized car, an insurer can quote a higher price because no other competitor is willing to underwrite that policy.
Price elasticity in insurance
The price elasticity models in insurance can hence be classified into two categories. The first one is for normal automobiles, in this case, the models would be like in the retail industry for nonessential goods— the customer would be quite sensitive to the price.
In the second type of price elasticity model, for specialty automobile lines, the model’s behavior would be like for the essential goods, so the customer would not be price-sensitive, and in some cases even more likely to buy with the price increase, because we are underwriting a policy which is very niche.
And in cases of speciality lines, the quoted price of the policy can be proportional to the probability of the customer buying the policy. It simply means that more risky or niche a policy is, lesser is the competition to underwrite it and hence less options the customer has, which means the probability of buying that policy is much higher.
Our Use Case: The dataset and predictive modeling
So now since we have understood the basics of price elasticity and how it applies to the insurance industry. Let us talk about the use case at hand.
Dataset
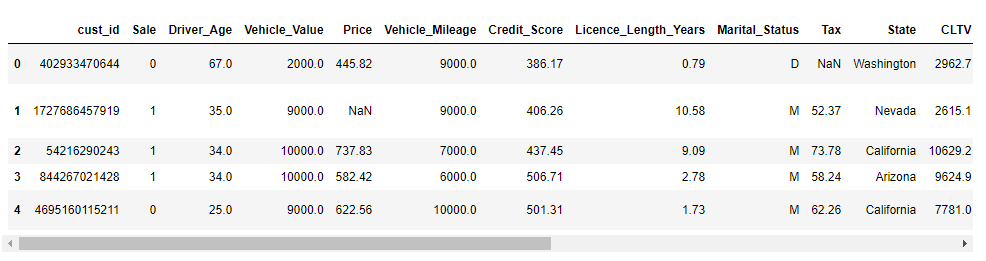
We used the Kaggle dataset on the automobile insurance quotes and sales and further augmented it using synthetic data generation.
We split the data into — train, validation, and test dataset. Here is a screenshot of the dataset:
Predictive models and Evaluation Metrics
From the above dataset, we did some feature engineering and built some predictive models to predict whether a given customer will buy a policy or not.
We tried various classification models and evaluated the performance of the there models on different metrics. The results are summarized below:
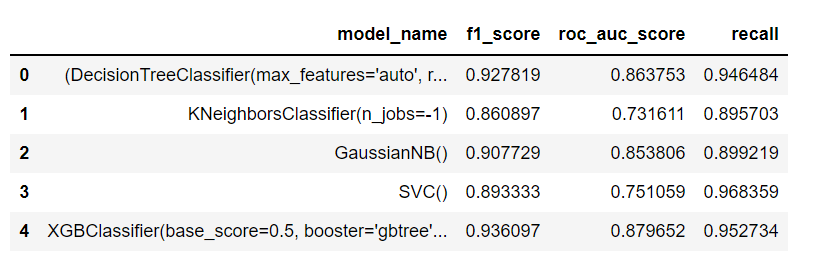
Here, the key metric for us to consider is — recall and then F1 score, because we do not want to miss out on the people who will buy the policy by predicting they will not.
The best model hence was XGBoost with a recall of 0.95 and an f1 score of 0.93. So we shall use this model for making predictions on the test dataset.
On the test dataset, it gave us an f1 of 0.93 and a recall of 0.94.
Feature importance
Now we have established the predictive power of the models, the next step would be to understand which features contribute the most to this predictive power. For the price elasticity model to work, the price of the quote should be one of the most important features.
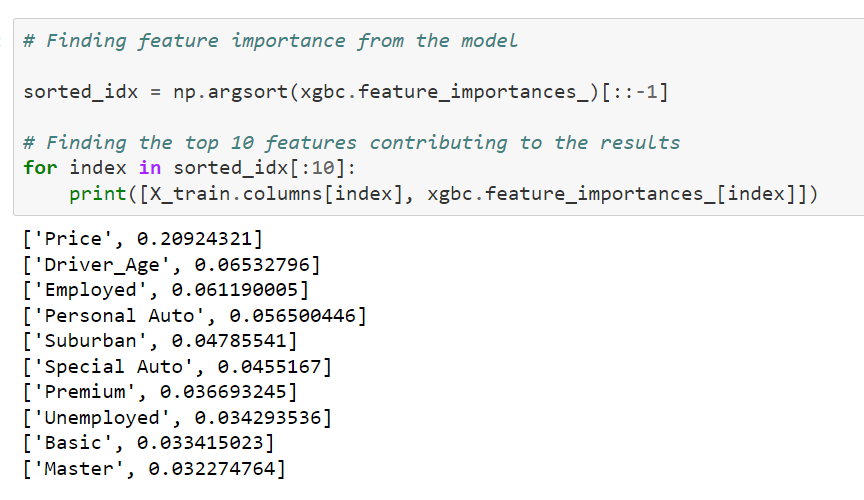
Hence, quote price is the most important factor for the XGBoost model. It is important to note that the price of the quote has 4 times more predictive power than the second next feature and 10 times more predictive than the 10th feature in the list.
Just to confirm this finding, we run an OLS model and find the results and see how much is the coefficient of quote price.
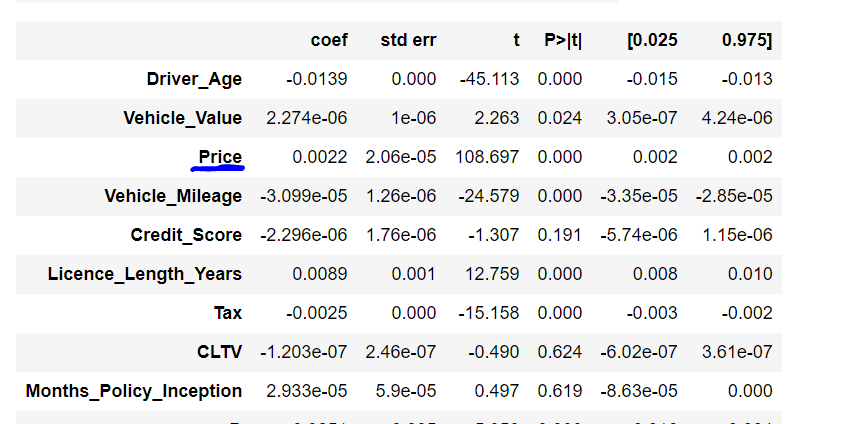
It is important to note the sign of the coefficient of quote price is positive, which means that the price positively correlated to the probability to sales.
The spectacular widgets of Atoti
Price elasticity is all about altering the quote price and seeing the impact it has on the sale of the policy. From a business perspective, it would be really interesting to apply various rules of scenarios and what if and put them in the model and get the results.
Here, we will define the KPIs and visualize them on the prediction on the test dataset. In the next step, we will create different create then see how the KPIs are impacted under these scenarios.
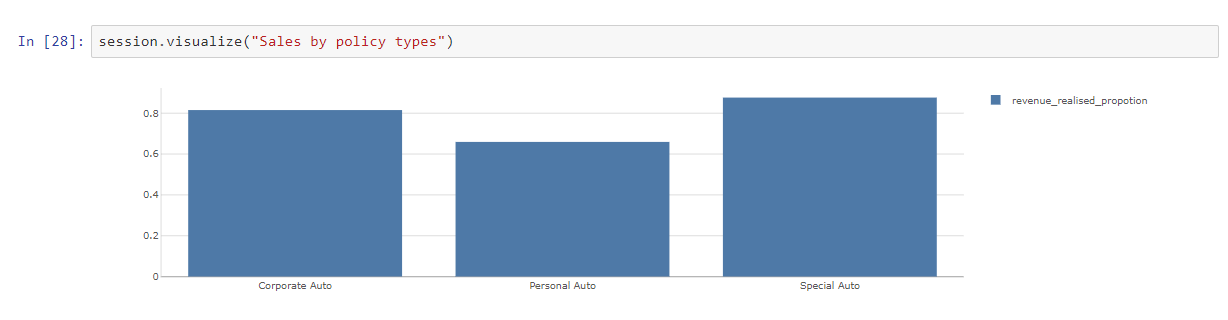
Defining and visualizations KPIs on the test dataset
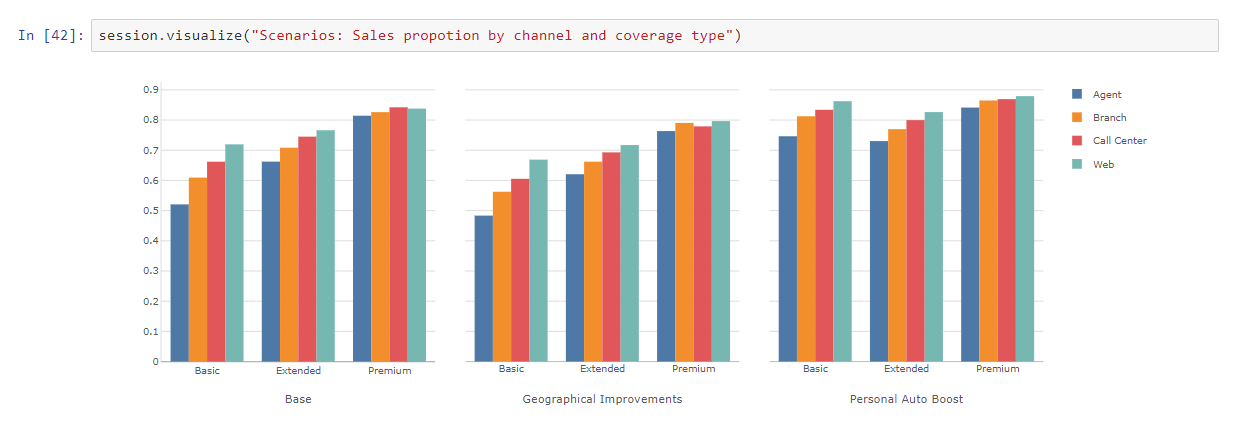
We created various KPIs in Atoti around the proportion of sales captured and the proportion of revenue captured. With Atoti, you can create new measures on the fly using the existing measures.
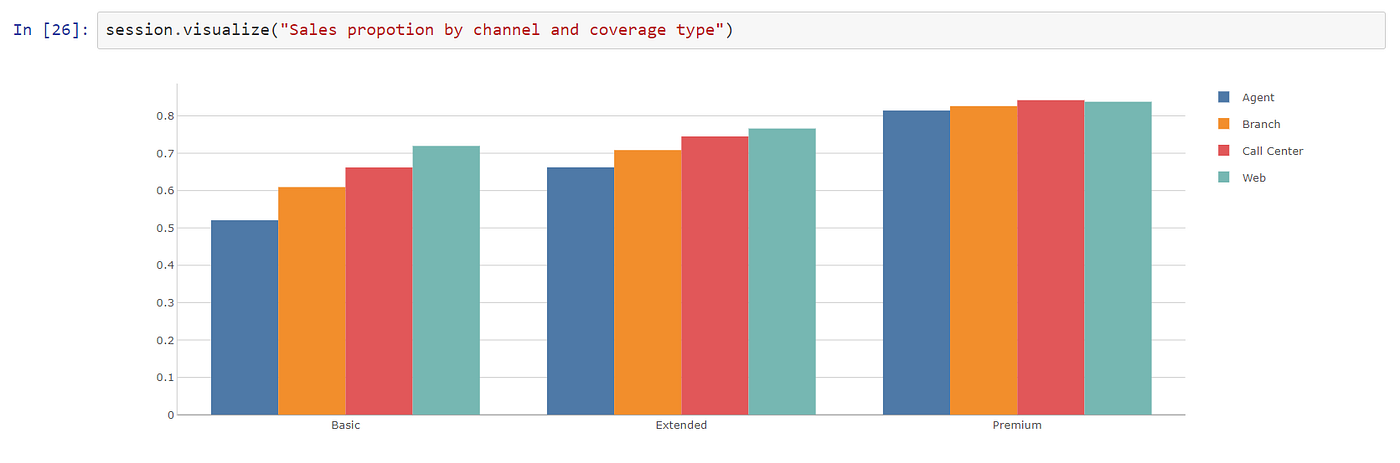
Once the widgets were created, we used the Atoti BI app in the Jupyterlab notebook to create different widgets.

Thanks to Atoti, we can create interactive and useful visualizations without any coding — simply drag and drop the measures and hierarchies of interest.
Creating scenarios in Atoti
Simulations are a way to compare several scenarios and do what-if analysis. This helps understanding how changing the source data or a piece of the model impacts the key indicators.
In Atoti, the data model is made of measures chained together. A simulation can be seen as changing one part of the model, either its source data or one of its measure definitions, and then evaluating how it impacts the following measures.
We can create two main types of scenarios in Atoti:
- Source simulation: Simulation of the source and using the entire pipeline on the new data source.
- Parameter simulation: Simulation a parameter based on some metrics and creating the whole pipeline from it.
Note that all the existing measures are immediately available on the new data in both the above simulations.
Creating the price elasticity model: Interaction between Atoti and the machine learning model
As step one, we have loaded the test dataset along with predictions in Atoti. And then we did visualizations on the KPIs using that dataset.
Now, we will create a scenario based on the quote price and then do a prediction using the new price. This data will be loaded back in Atoti as a source scenario and hence, the visualizations will be updated on that price simulation.
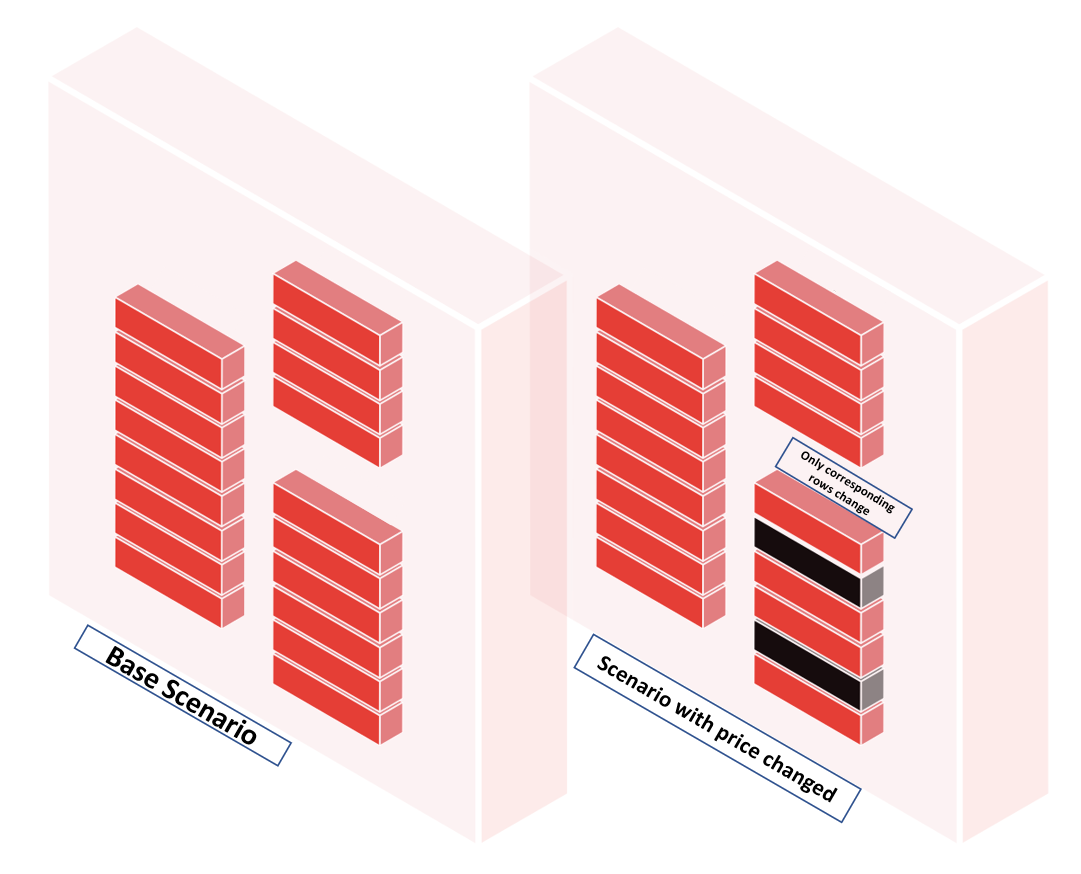
So, the session now will have multiple scenarios and the only differences between them are the lines corresponding to the products with better prices, everything else is shared between the scenarios and has not been duplicated: source scenarios in Atoti are memory-efficient.
Here we are considering the following scenarios:
- The Pareto Principle — Increase the price by 20% for all the policies for which sales probability is more than 80% Drop the price by 20% for policies that have a probability to be bought less than 20%. This will affect the most price-sensitive customers from the customers who have not bought the policy.
On the other hand, this will help identify the most price-insensitive customers from the customers who have actually bought the policy. - Boost Personal Auto and Basic Coverage — of all the policy types, personal auto, and basic coverage are the weakest sections. In this scenario, we will see what happens if we try to boost the personal auto lines by increasing the policy price by 25%? and the basic coverage by 15%.
- Geographic Improvements — In the states of Oregon and Washington, suburban areas are not performing well. So we can try and drop the prices by 10% for customers in rural areas of Oregon and drop by 15% in urban areas of Washington to see how price-sensitive the customers in the respective segment are.
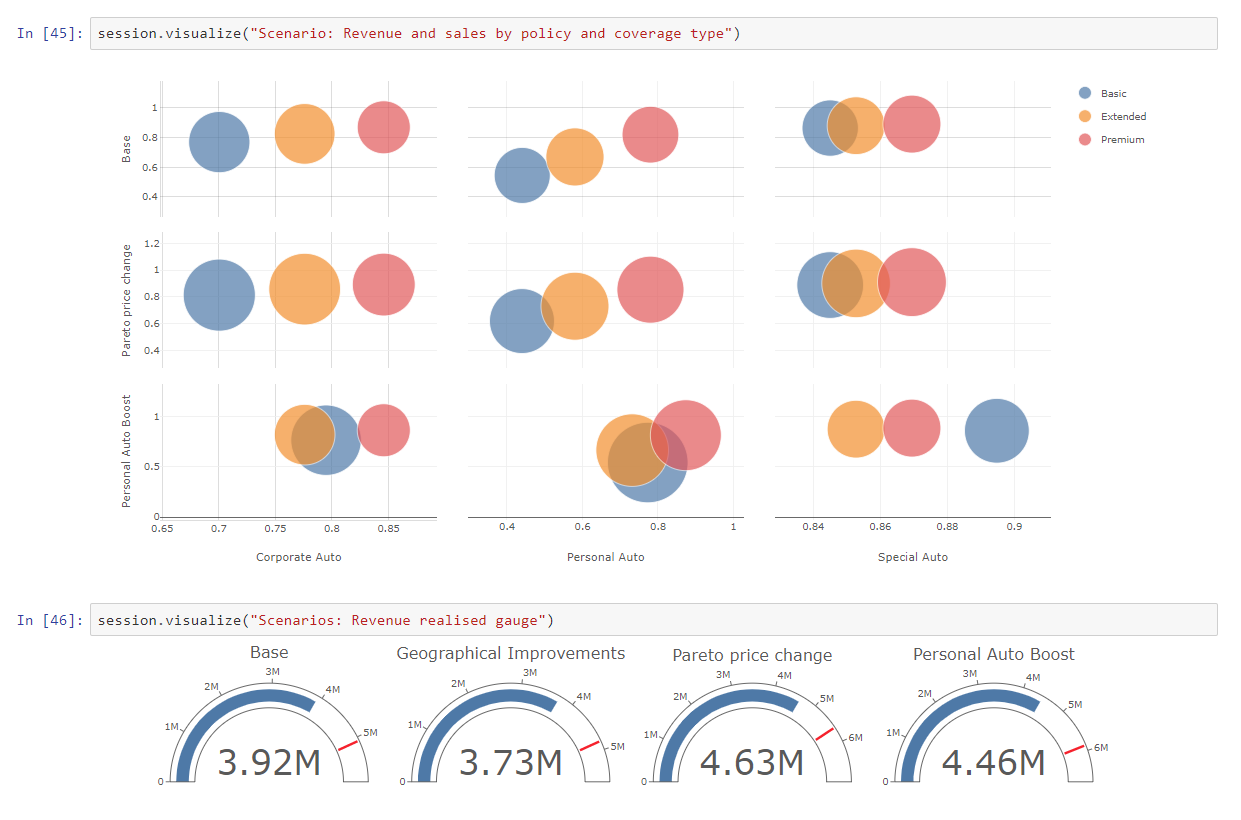
After creating the scenarios, we can see that the widgets have been automatically updated. Now we can visualize the widgets and see the impacts on our KPIs under these scenarios. Here are the updated widgets:
Finally, all the information can be compiled in the form of a dashboard and shared with other users. The dashboard we created has different tabs and filers for the scenarios and cases.
Access Controlling Atoti Dashboards
Access control at folders and dashboards level using roles. Users from different departments and teams will be able to access the system. However, there may be dashboards that are team-specific and should not be accessible by others.
In this case, we can have a department and team-specific roles. Thereafter, business analysts or key users with the “ROLE_SHARE” access can now design dashboards and share them with their respective teams and departments.
You can know more about ROLE_SHARE and Atoti+ here.
Conclusion
In this article, we used Atoti and a predictive model based on XGBosst classification to deduce the price elasticity of different customer buckets under various scenarios.
We saw above, how Atoti can seamlessly integrate with a predictive model to create different what-if scenarios and hence, identify the price-sensitive and insensitive customers across different segments.
Now we would like to invite you to try for yourself how Atoti can help you simplify what-if scenarios and the price elasticity of demand!
For the detailed source code and many other such interesting use cases, do check out the Atoti notebook gallery on GitHub. This notebook can be accessed here.