
See How We use an AI-based Solution to Detect Masked Faces in Videos, Calculate the Risk of Infection with Covid, and Raise Alert in Real-Time.
Overview
In this article, we demonstrate how to use a masked face detector model in combination with the Atoti platform to build a solution that helps to monitor the wearing of a Covid mask and calculate the risk of infection, then raise an alert in real-time.
We are going to address the following points:
- Context
- Description of the Solution
- How it Works
- Calculation of the Risk
- Monitoring of the Risk
Here, we focus on exhibiting how seamless it is to create an application using Atoti on top of a deep learning model to produce a real-time dashboard leveraging the results from this model.
The creation of the masked face detector will be detailed in a separate article coming soon.
Context
Compliance with health measures is essential in this time of the Covid-19 pandemic, especially in confined or closed spaces.
In particular, it is recommended to wear a Covid mask in order to limit the spread of Covid-19 over the population.
This analysis does not aim to tell the people what they should do or track their behavior. The goal is not to make people feel like they are being watched permanently.
The only idea here is to propose a system that could help to prevent the spread of the Covid by monitoring and raising an alert in case of a critical situation happens.
Description of the Solution
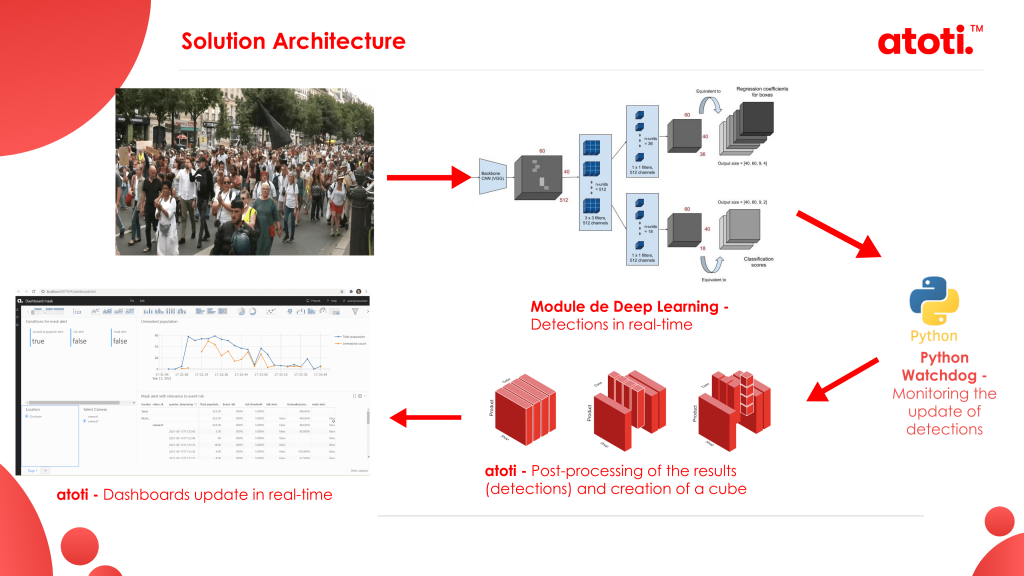
The solution is composed of:
- A deep learning module: detects masked faces in videos from cameras
- A Watchdog: Python API and shell utilities that monitor directory specified where the results of the detections are stored constantly
- Atoti: uploads the results of the detections from the specified directory and post-processes them. Then, it renders them in the form of health indicators in an interactive dashboard and raises an alert whenever predefined critical thresholds are crossed.
If you want to know more about Atoti, I would recommend you to watch this introductory video tutorial and more tutorials here.
How it Works
If we have camera feeds of people walking, how can we create a system that monitors and acknowledges if people are masked?
Using a fine-tuned Faster R-CNN model, we can create a module that detects whether faces are properly masked or unmasked.
As the deep learning module detects if a person is masked, it can output the results into a flat file. Integrating with the Python library Watchdog, we can continuously upload the data file into Atoti.
Atoti can compute the risk of COVID-19 contamination on the fly, using the population size and rate of incidence. Along with the mask-up rate detected by the deep learning model, it can trigger an alert message when the number of people without masks increases the risk of contracting COVID 19.
This exhibits how seamless it is to use Atoti on top of a deep learning model, and create a real-time dashboard to rapidly create an AI-based application.
Calculation of the Risk
The live masked faces detections from the Faster R-CNN model are appended to existing files in the results folder and uploaded into Atoti on the fly. This is the place where the magic happens.
Data Enrichment
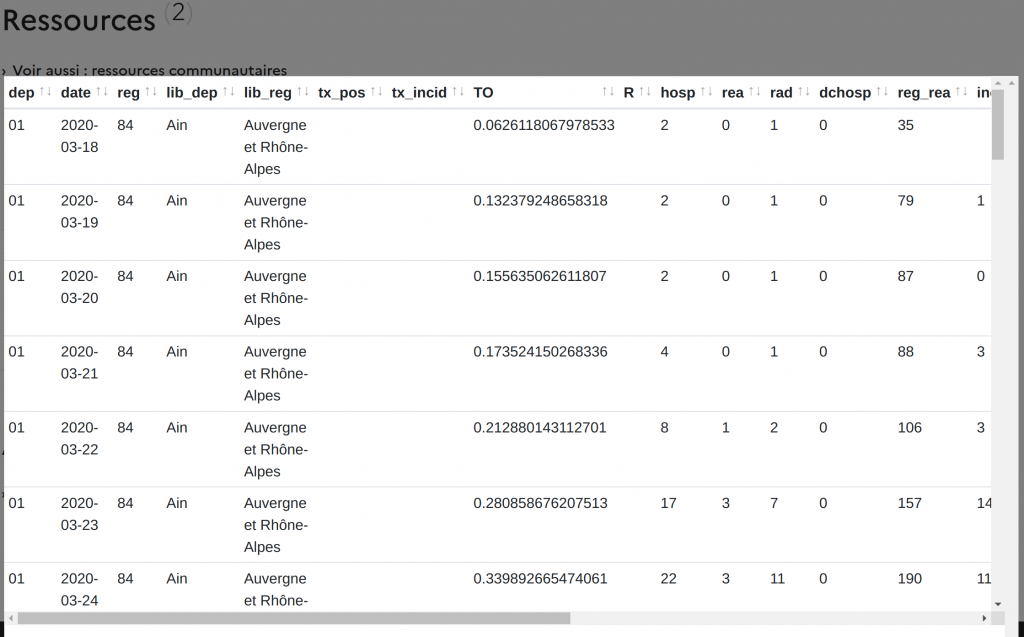
In Atoti, we also upload:
- Data providing the location of the cameras.
- Data providing information about the incidence rates in the departments in France.
In fact, our calculation of the risk of infection with Covid-19 is based on the formula issued from the French website Covid Tracker, which is also trusted and used by the French government to monitor the health situation in France during this pandemic. So, we implemented this calculation in Atoti as a measure.
The Covid Tracker calculation also requires the incidence rate, which depends on the location related to the risk assessment.
Here, we consider the incidence rate at the departments level in order to evaluate the risk. We get this information in open data from the French government website.
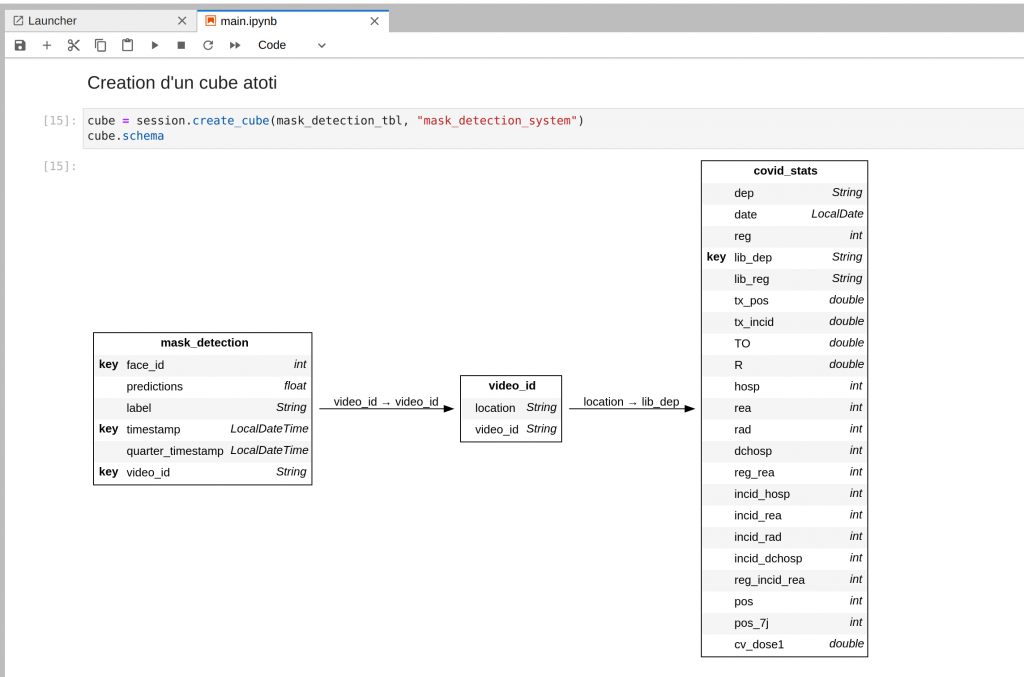
We perform a join of the different data sources in Atoti: the results from the detections, the locations of the cameras, and the Covid-19 incidence rates. Then, we create a cube based on the resulting table.
Atoti provides a very nice feature that allows us to visualize the schema of the cube and verify all the data involved in its creation directly within your Python notebook. This allows also to check the keys used to perform the joins for example.
The Formula of the Risk Calculation
Covid Tracker provides a Covid-19 exposure risk calculator which, given the incidence rate and the number of people in a place, gives you the probability of having at least one person infected with Covid-19 within these people observed.
The detailed formulation of the exposure risk calculation is given here below:
“This probability « p » can be estimated thanks to the incidence: an incidence of 1 000 means that among 100 000 people, 1 000 are positive; in other words, that 1% of them are positive. We can now say that p = incidence / 100 000. Note that this probability is very likely to be under-estimated. As the logical event « at least one person is positive” is the contrary of the event “among all people, none is positive”, we can guess how likely it is that at least one person is Covid +: 1 — ( 1 — i / 100 000)^N, With « i » the incidence and « N », the number of people.” — Covid Tracker
This formula is implemented as a measure in Atoti and used for real-time calculation while the videos (recording from cameras) are playing.
Monitoring of the Risk & Alerting
In addition to the precedent risk exposure calculation, our solution checks if the following two conditions are fulfilled to decide whether to raise automatically a risk alert or not:
- If the Covid-19 exposure risk crosses a critical threshold
- If the proportion of people not wearing a mask is above a critical threshold
So, we define the above two quantities in the form of measures in Atoti. Note that, as Atoti ingests the data on the fly, these measures are being updated automatically without requiring any intervention from the user.
In our use case, we set the mentioned related thresholds arbitrarily, but they should be adapted to relevant values for your specific use.
The following table shows the rule followed by the alerting system:
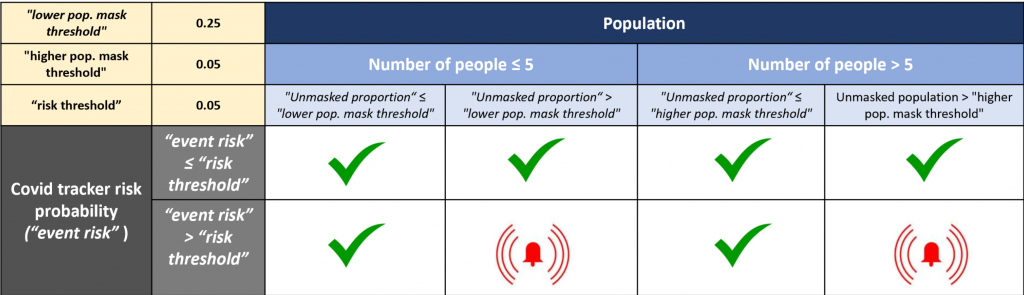
In the table here above, we distinguish two situations to evaluate the risk related to the fact of not wearing a mask, namely when the number of people observed is: less than 5, or more than 5. Again, we did it for the sake of the demonstration, which was relevant to our specific data. But, of course, this is not mandatory to make the system work.
Using Atoti, we can monitor in real-time the evolution of the risk by creating an interactive dashboard to display all the preceding metrics on the fly.
Finally, we define a function that triggers a vocal message automatically to remind the necessity of wearing a mask whenever the risk of infection with Covid-19 reaches a critical level. In our particular use case, we decide to assess the risk level every 15 seconds and raise a risk alert only if it has passed its critical value at least once during the last five minutes.
So, with our system, you can hear a risk alert message at most once every five minutes, which is a window we considered as reasonable enough in order to not disturb too much the people present in the place.
It is important to notice that this system can monitor multiple locations (cameras) at the same time and make the results available in one unique interactive dashboard that allows you to switch from one camera to another.
Conclusion
We have seen how to use Atoti to boost the delivery from our deep learning model in order to build a real-time application that can:
- Leverage the data from multiple sources (cameras) simultaneously
- Post-process the results of the masked face detections on the fly
- Make them available in their final form within an interactive dashboard that keeps updating automatically in real-time, and that allows you to switch from one location to another one.
We have also seen how seamless it is to implement this using Atoti as it requires just a few lines of code in Python.
All the code is available in the Github project here.
Hope you enjoyed this use case. Waiting for your feedback! 🙂
Voilà!
PS: I will be publishing very soon the article detailing the complete approach of the creation of the masked face detection model. Stay tuned! 🙂
References
Covid Tracker. Covid19 Exposure Risk Calculator.
Covid data from French authorities. Synthèse des indicateurs de suivi de l’épidémie COVID-19.


