Measure simulations and scenarios have been streamlined, allowing for greater flexibility
As part of v0.6.0, we are changing how we handle simulations. Read on for more details.
Measure simulation vs Parameter simulation
In previous versions of Atoti, we could set up a function to create a measure simulation via the cube.setup_simulation() function. We’re replacing this with the cube.create_parameter_simulation() function in v0.6.0.
Previously, cube.setup_simulation() arguments for measures were limited to multiply, replace, and add. Because of this, the user was limited to simulating measures via those three mechanisms.
With parameter simulations we have the ability to create a new parametric measure which can be included in the definition of new measures for a simulation. Via cube.create_parameter_simulation() the user creates a new simulation which can then be populated with parameters for adjusting measures. Then specific scenarios can be added to the simulation based on the defined parameter and measures. As in setup_simulation(), the user can specify a name for the simulation and the levels whose elements will be affected.
With this new function, it is now easier to imagine how we can adjust an existing measure for simulation. Each cube.create_parameter_simulation() will create a new parameter measure, which can be used to impact another measure. And, it will create a table with the name given in the name argument, as demonstrated below:

Creating and using a Parameter Simulation
Using parameter simulations is straightforward. To create a parameter simulation, begin by specifying:
- a name for the simulation,
- a name for the parameter measure,
- the default value you want the parameter measure to take,
- which levels within your cube you would like impacted, and
- a customized name for the original dataset if necessary
Take this example from our World Population growth notebook in our GitHub notebook gallery.
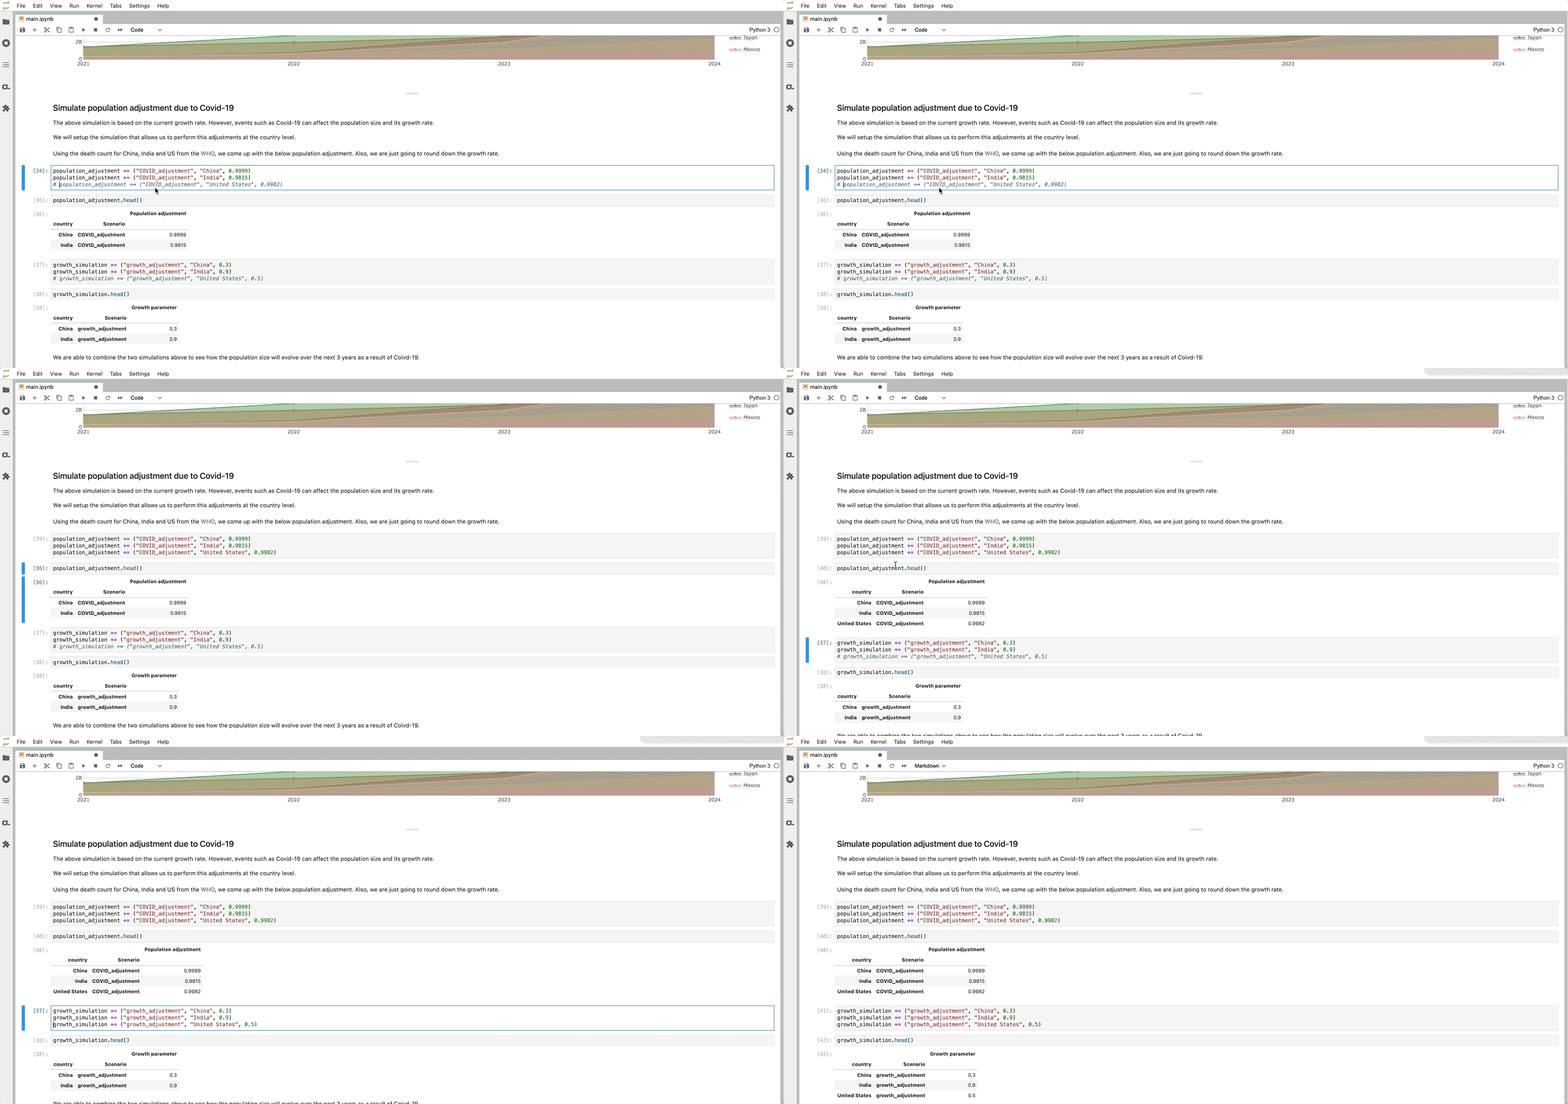
With parameter simulations, we can create a parameter measure as shown below:
population_adjustment = cube.create_parameter_simulation(
    "Population adjustment simulation",
    measure_name="Population adjustment",
    default_value=1,
    base_scenario_name="Normal growth",
    levels=[l["country"]],
)
We can also create a second one for adjusting the growth rate. Since we have the existing ‘m[“growth_rate.MEAN”]]’, we can use the parameter simulation to create a ‘Growth parameter’ to replace the growth rate in different scenarios:
growth_simulation = cube.create_parameter_simulation(
    "Growth adjustment simulation",
    measure_name="Growth parameter",
    base_scenario_name="Normal growth",
    levels=[l["country"]],
)
In using these parameter measures, we have flexibility in how they impact the base scenario. Here, we will use the new Growth parameter to replace the growth rate, otherwise, we use the growth rate from the original dataset.
m["Growth rate"] = tt.where(
    m["Growth parameter"] != None, m["Growth parameter"], m["growth_rate.MEAN"]
)
We will also specify how we want our population adjustment to apply
m["increments"] = tt.where(
    m["Years forecast"] == 0,
    m["population"],
    m["population"]
    - tt.math.ceil(
        (m["2021_last_updated.SUM"] * m["Population adjustment"])
        * ((1 + m["Growth rate"]) ** (m["Years forecast"] - 1))
    ),
)
Note that we are using both the newly created ‘population adjustment’ measure and adjusted ‘growth rate’ measures to impact the increments measure!
When running the simulation, the measure you are simulating will take the parameter measure as an input, applying the specified value for the member specified for that level, and the default for all other members of the level.
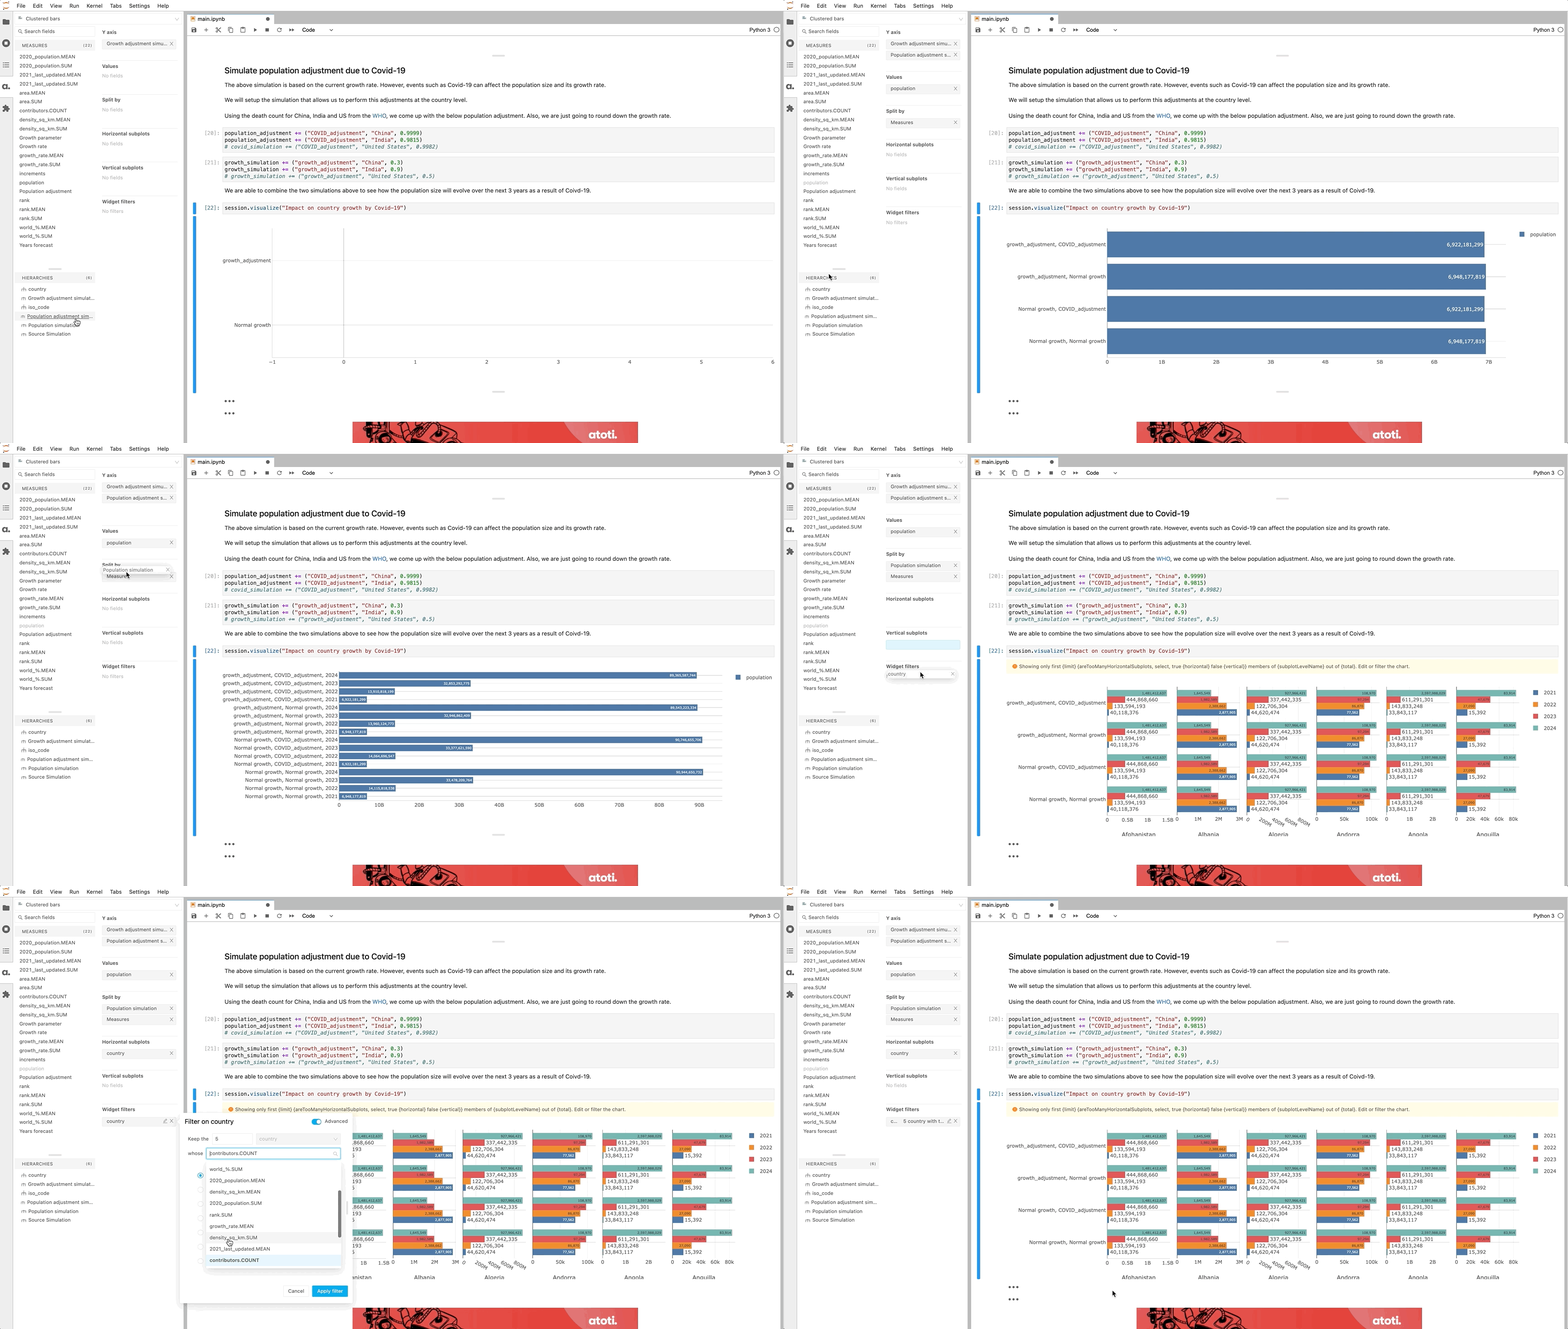
Just like before, we can visualize our simulations–here, we combined them in our visualization.

We hope you enjoy the streamlined experience our parameter simulations offer!


