In this article, we shall discuss one of the ubiquitous steps in the machine learning pipeline — Feature Scaling. This article’s origin lies in one of the coffee discussions in my office on what all models actually are affected by feature scaling and then what is the best way to do it — to normalize or to standardize or something else?
In this article, in addition to the above, we would also cover a gentle introduction to feature scaling, the various feature scaling techniques, how it might lead to data leakage, when to perform feature scaling, and when NOT to perform feature scaling. So tighten your reading glasses and read on…
An increasing number of features on different scales make machine learning problems hard to handle, is feature scaling the solution?
What is Feature Scaling?
Feature scaling is a method used to normalize the range of independent variables or features of data. In data processing, it is also known as data normalization and is generally performed during the data preprocessing step. Just to give you an example — if you have multiple independent variables like age, salary, and height; With their range as (18–100 Years), (25,000–75,000 Euros), and (1–2 Meters) respectively, feature scaling would help them all to be in the same range, for example- centered around 0 or in the range (0,1) depending on the scaling technique.
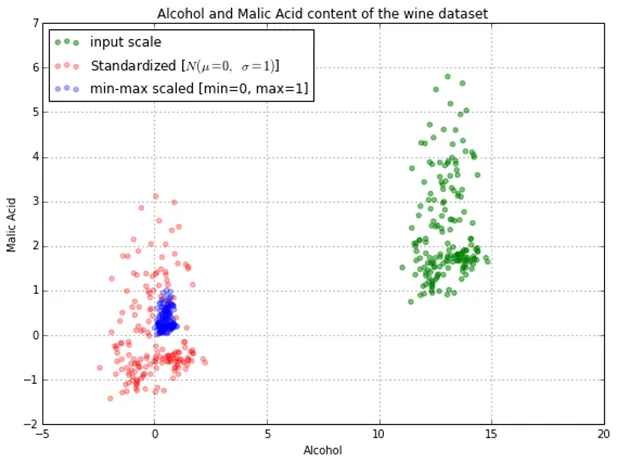
In order to visualize the above, let us take an example of the independent variables of alcohol and Malic Acid content in the wine dataset from the “Wine Dataset” that is deposited on the UCI machine learning repository. Below you can see the impact of the two most common scaling techniques (Normalization and Standardization) on the dataset.

Methods for Scaling
Now, since you have an idea of what is feature scaling. Let us explore what methods are available for doing feature scaling. Of all the methods available, the most common ones are:
Normalization
Also known as min-max scaling or min-max normalization, it is the simplest method and consists of rescaling the range of features to scale the range in [0, 1]. The general formula for normalization is given as:

Here, max(x) and min(x) are the maximum and the minimum values of the feature respectively.
We can also do a normalization over different intervals, e.g. choosing to have the variable laying in any [a, b] interval, a and b being real numbers. To rescale a range between an arbitrary set of values [a, b], the formula becomes:

Standardization
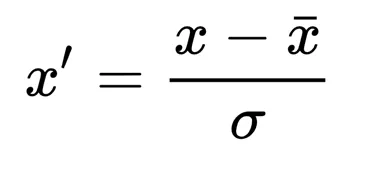
Feature standardization makes the values of each feature in the data have zero mean and unit variance. The general method of calculation is to determine the distribution mean and standard deviation for each feature and calculate the new data point by the following formula:

Here, σ is the standard deviation of the feature vector, and x̄ is the average of the feature vector.
Scaling to unit length
The aim of this method is to scale the components of a feature vector such that the complete vector has length one. This usually means dividing each component by the Euclidean length of the vector:

In addition to the above 3 widely-used methods, there are some other methods to scale the features viz. Power Transformer, Quantile Transformer, Robust Scaler, etc. For the scope of this discussion, we are deliberately not diving into the details of these techniques.
The million-dollar question: Normalization or Standardization
If you have ever built a machine learning pipeline, you must have always faced this question of whether to Normalize or to Standardize. While there is no obvious answer to this question, it really depends on the application, there are still a few generalizations that can be drawn.
Normalization is good to use when the distribution of data does not follow a Gaussian distribution. It can be useful in algorithms that do not assume any distribution of the data like K-Nearest Neighbors.
In Neural Networks algorithm that require data on a 0–1 scale, normalization is an essential pre-processing step. Another popular example of data normalization is image processing, where pixel intensities have to be normalized to fit within a certain range (i.e., 0 to 255 for the RGB color range).
Standardization can be helpful in cases where the data follows a Gaussian distribution. Though this does not have to be necessarily true. Since standardization does not have a bounding range, so, even if there are outliers in the data, they will not be affected by standardization.
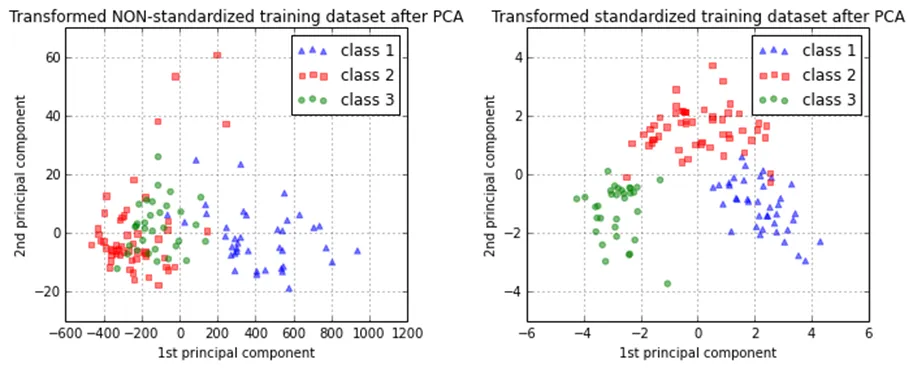
In clustering analyses, standardization comes in handy to compare similarities between features based on certain distance measures. Another prominent example is the Principal Component Analysis, where we usually prefer standardization over Min-Max scaling since we are interested in the components that maximize the variance.
There are some points which can be considered while deciding whether we need Standardization or Normalization
- Standardization may be used when data represent Gaussian Distribution, while Normalization is great with Non-Gaussian Distribution
- Impact of Outliers is very high in Normalization
To conclude, you can always start by fitting your model to raw, normalized, and standardized data and compare the performance for the best results.
The link between Data Scaling and Data Leakage
In order to apply Normalization or Standardization, we can use the prebuilt functions in scikit-learn or can create our own custom function.
Data leakage mainly occurs when some information from the training data is revealed to the validation data. In order to prevent the same, the point to pay attention to is to fit the scaler on the train data and then use it to transform the test data. For further details on data leakage, you can check out my article on data leakage and how to mitigate it.
When to scale your data?
After building an understanding of how to do data scaling and which data scaling techniques to use, we can now talk about where to use these data scaling techniques.
Gradient Descent Based Algorithms
If an algorithm uses gradient descent, then the difference in ranges of features will cause different step sizes for each feature. To ensure that the gradient descent moves smoothly towards the minima and that the steps for gradient descent are updated at the same rate for all the features, we scale the data before feeding it to the model. Having features on a similar scale will help the gradient descent converge more quickly towards the minima.
Specifically, in the case of Neural Networks Algorithms, feature scaling benefits optimization by:
- It makes the training faster
- It prevents the optimization from getting stuck in local optima
- It gives a better error surface shape
- Weight decay and Bayes optimization can be done more conveniently
Distance-Based Algorithms
Distance-based algorithms like KNN, K-means, and SVM are most affected by the range of features. This is because behind the scenes they are using distances between data points to determine their similarity and hence perform the task at hand. Therefore, we scale our data before employing a distance-based algorithm so that all the features contribute equally to the result.
For feature engineering using PCA
In PCA we are interested in the components that maximize the variance. If one component (e.g. age) varies less than another (e.g. salary) because of their respective scales, PCA might determine that the direction of maximal variance more closely corresponds with the ‘salary’ axis, if those features are not scaled. As a change in the age of one year can be considered much more important than the change in salary of one euro, this is clearly incorrect.

What about regression?
In regression, it is often recommended to scale the features so that the predictors have a mean of 0. This makes it easier to interpret the intercept term as the expected value of Y when the predictor values are set to their means. There are few other aspects that vouch for feature centering in case of regression:
- When one variable has a very large scale: e.g. if you are using the population size of a country as a predictor. In that case, the regression coefficients may be on a very small order of magnitude (e.g. e^-9) which can be a little annoying when you’re reading computer output, so you may convert the variable to, for example, population size in millions or just perform a Normalization.
- While creating power terms: Let’s say you have a variable, X, that ranges from 1 to 2, but you suspect a curvilinear relationship with the response variable, and so you want to create an X² term. If you don’t center X first, your squared term will be highly correlated with X, which could muddy the estimation of the beta. Centering first addresses this issue.
- Creating interaction terms: If an interaction/product term is created from two variables that are not centered on 0, some amount of collinearity will be induced (with the exact amount depending on various factors).
Centering/scaling does not affect your statistical inference in regression models — the estimates are adjusted appropriately and the p-values will be the same. The scale and location of the explanatory variables do not affect the validity of the regression model in any way.
The betas are estimated such that they convert the units of each explanatory variable into the units of the response variable appropriately.
Consider the model:
y=β0+β1×1+β2×2+…+ϵy=β0+β1×1+β2×2+…+ϵ.
The least-squares estimators of β1,β2,…β1,β2,… are not affected by shifting. The reason is that these are the slopes of the fitting surface — how much the surface changes if you change x1,x2,…x1,x2,… one unit. This does not depend on location. The scaling doesn’t affect the estimators of the other slopes. Thus, scaling simply corresponds to scaling the corresponding slopes.
To conclude, technically, feature scaling does not make a difference in the regression, but it might give us some practical benefits and in further feature engineering steps.
When scaling your data is NOT necessary?
Tree-based algorithms
Tree-based algorithms are fairly insensitive to the scale of the features. A decision tree is only splitting a node based on a single feature. The decision tree splits a node on a feature that increases the homogeneity of the node. This split on a feature is not influenced by other features. Hence, there is virtually no effect of the remaining features on the split. This is what makes them invariant to the scale of the features.
Should you ALWAYS do feature engineering?
If there are some algorithms that are not really affected by feature scaling and can work with or without feature scaling, but then there are some algorithms that just cannot work without the features being scaled, does it not make sense to ALWAYS perform feature engineering?
Well, not ALWAYS — imagine classifying something that has equal units of measurement recorded with noise. Like a photograph or microarray or some spectrum. In this case, you already know a-priori that your features have equal units. If you were to scale them all you would amplify the effect of features that are constant across all samples, but were measured with noise. (Like the background of the photo). This again will have an influence on KNN and might drastically reduce performance if your data had more noisy constant values compared to the ones that vary.
Some questions that you should ask yourself to decide whether scaling is a good idea:
- What would normalization do to your data wrt solving the task at hand? Should that become easier or do you risk deleting important information?
- Is the algorithm sensitive to the scale of the data?
- Does the algorithm or its actual implementation perform its own normalization?
Now you know-all about feature scaling, the next step is to apply it correctly in your ML pipelines.
Thank you for your time and attention. Please check out our GitHub gallery for some interesting use cases and to see a python library with an in-built BI tool in action!
You can also see similar QnA and other articles we have published on our medium page.


