A product catalog example
In this Atoti tutorial, I will walk you through how you can create a hierarchy – aka parent-child data structure – to interactively aggregate and drill down using Python libraries Treelib and Atoti.
The example I’ll be using is an e-commerce product catalog, and the same technique can be applied to create natural hierarchies with many levels: for example, legal entities structure, regional hierarchies, and so on
UPDATE: The GIFs and code snippets in this article are based on an older version of atoti. We have released much smoother and even more functional dashboards and widgets with the latest version of atoti. Check out this link to see the documentation of the latest version of atoti.
Users will be able to then drag and drop the hierarchy in atoti to interactively re-compute metrics, in my example, “unique sessions count” is displayed next to the multi-level e-commerce product catalog:
Parent-child data and Treelib
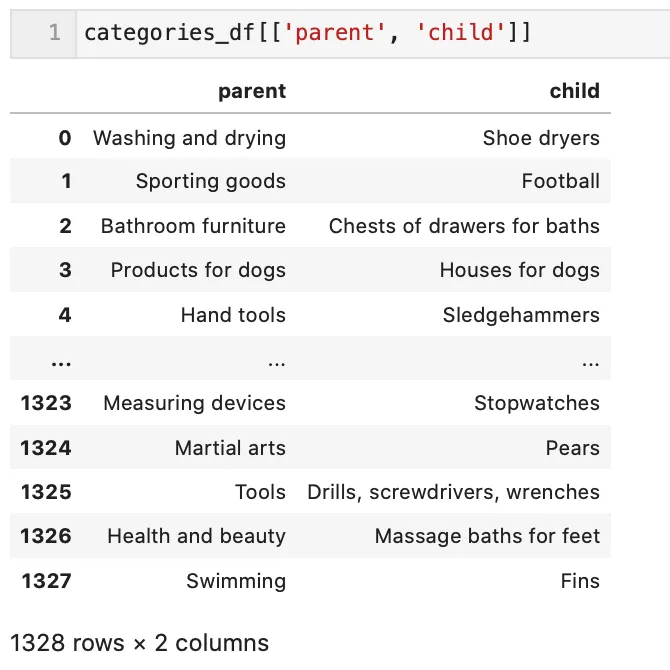
The common way to model a tree structure – is through parent-child relationships. In the following example, you can see a list of categories together with their parent categories. They form a multi-level tree – a product catalog.
Although parent-child pairs are a very natural way to express hierarchies, we can’t use them in its raw form for slicing and dicing. Think about a table in Excel – with different levels of a tree in separate columns, we can combine them in a pivot table to roll up and down through the levels of the catalog. Let’s extract the levels of the tree into separate columns! But before doing that, let’s look into a library that helps us flatten the tree easily – Treelib.
Treelib Python library makes it super easy to manipulate hierarchical data, as it provides common tree operations: traverse it, access leaves, nodes, subtrees, etc.
To create a tree object in the Treelib, I’m looping through the categories twice: to create the nodes of the tree and then to put them under the correct parent.
from treelib import Node, Tree

tree = Tree()
tree.create_node("Product Catalogue", 0)

# Creating nodes under root
for i, c in categories_df.iterrows():
    tree.create_node(c["name"], c["category_id"], parent=0)

# Moving nodes to reflect the parent-child relationship
for i, c in categories_df.iterrows():
    if c["parent_id"] == c["parent_id"]:
        tree.move_node(c["category_id"], c["parent_id"])
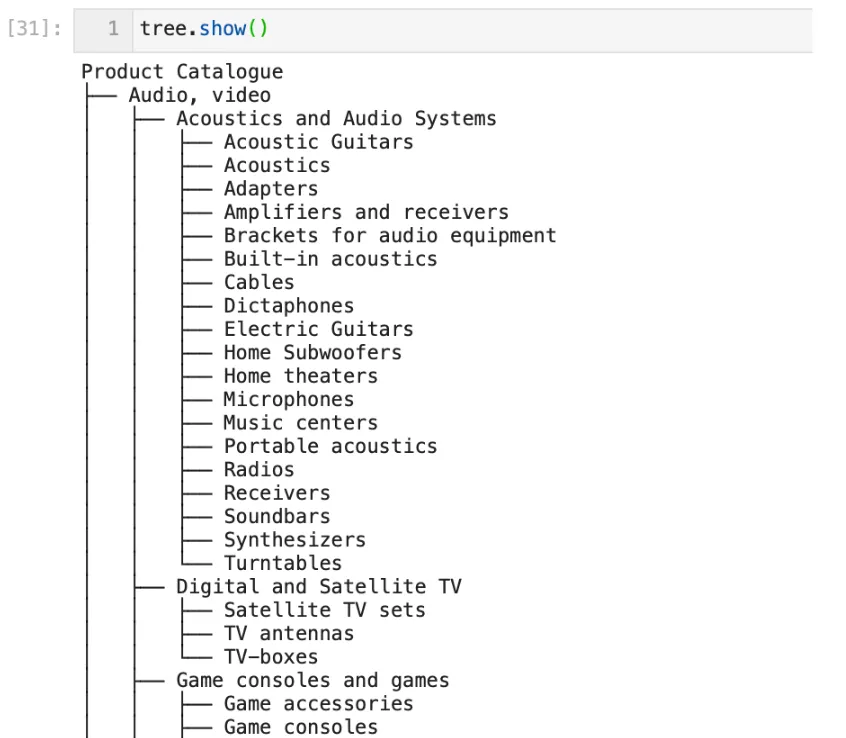
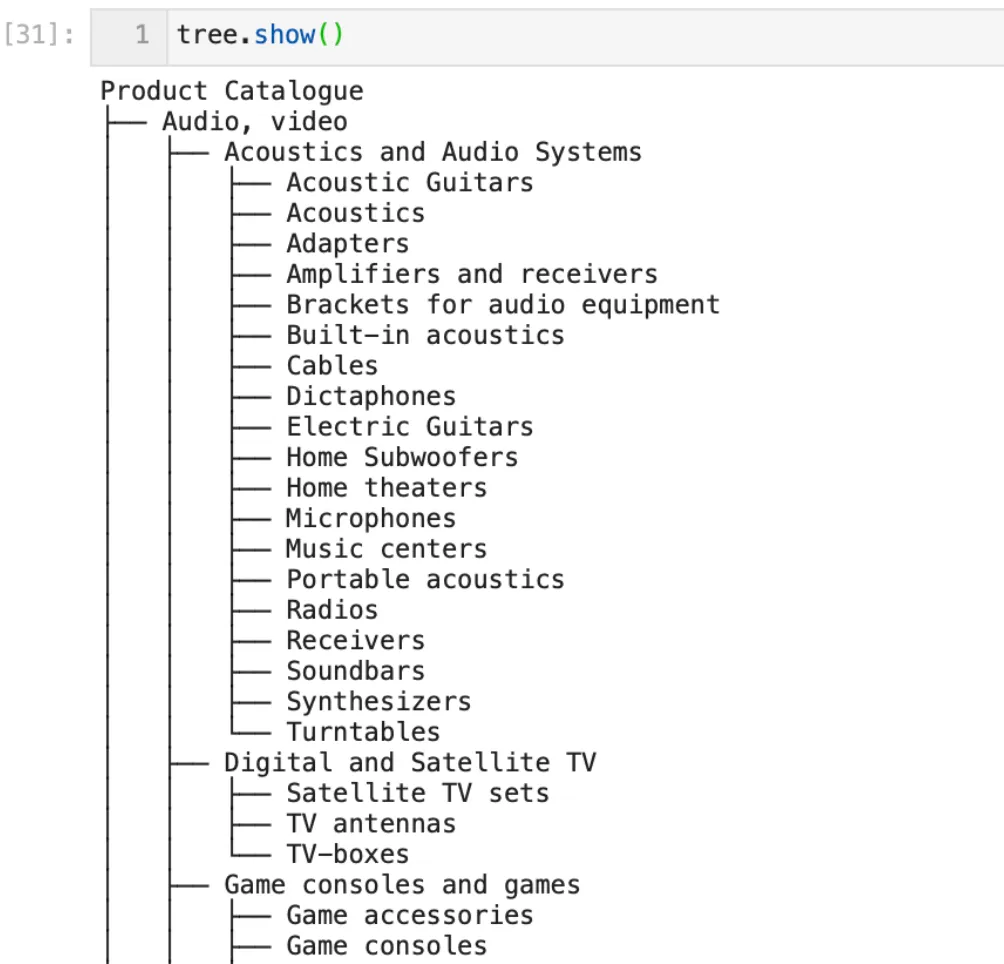
The tree.show() method in Treelib allows us to visualize the tree we’ve just created:
Levels of the hierarchy
So far we have invoked the Treelib module to create a tree object from the input data. Now let’s create columns for aggregation as discussed in the previous section.
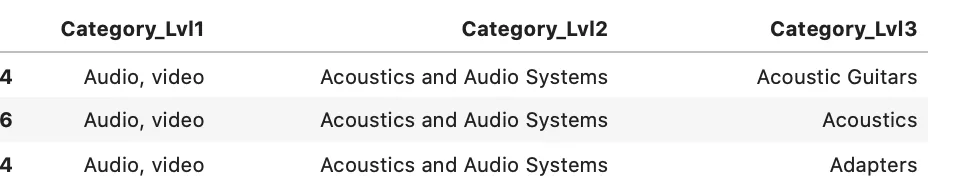
For the first three categories in the tree (see above), we’d need to create the following columns representing higher, lower, and leaf-level categories:

You will see later in this post, that the input data on the views and purchases (“facts”) is linked to the leaf level, in our case – “Category_Lvl3”. The fields “Category_Lvl2” and “Category_Lvl1” are broader groups, in other words, they are “parent” levels.
The method tree.paths_to_leaves() implemented in Treelib makes it trivial to create those columns. Every row in the following list represents the identifiers of the nodes, which can be translated into human-readable labels:
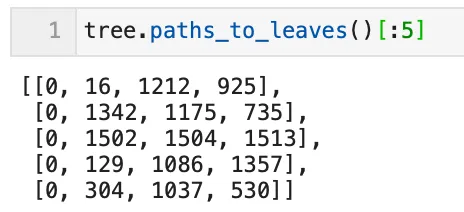
We just need to loop through the leaves and save nodes above each leaf as a row in, say, a CSV file. The only nuance is that the tree is unbalanced, some of the leaves do not reach the max depth of the tree:
print(
    "Min depth is {}, max depth is {}".format(
        min([len(i) for i in tree.paths_to_leaves()]),
        max([len(i) for i in tree.paths_to_leaves()]),
    )
)
# [Out]: Min depth is 3, max depth is 4.
As a workaround, I’m adding additional children under the leafs of the shorter “branches” – equal to the leaf itself.
By now, we’ve managed to create columns from the levels of the tree structure, set using parent-child relationships. Let’s move on and expose those attributes as a hierarchy for data analytics in Atoti.
Expand and collapse data in Atoti
The example in my previous post “Happy data scientist: How to build a business intelligence app with 10 lines of python code” was about loading an events log – views and purchases – for an online shop into Atoti cube for further analysis. Let’s see how to inject the product catalogue into the same app.
The base store – “Events” – provides product identifiers, so I’ll load product-to-category mapping and the categories levels we discussed above:
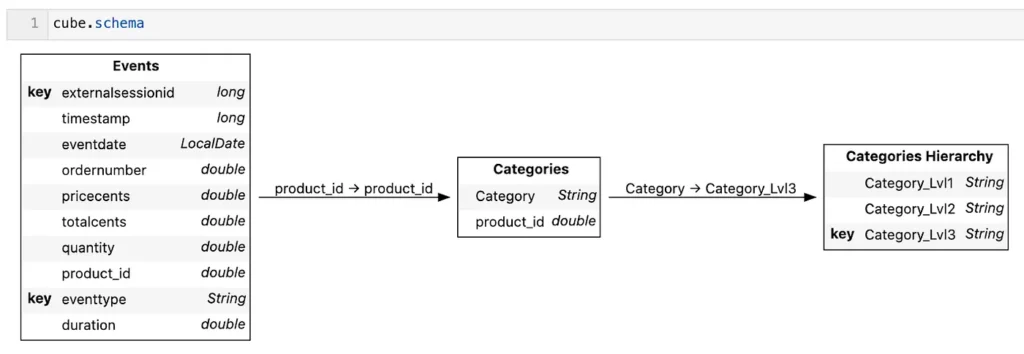
The following code snippet loads the data into Atoti from CSV files:
# loading product to category mapping into the cube
products_categories_ds = session.read_csv(
    "product-categories.csv", store_name="Categories"
)
events_ds.join(products_categories_ds, mapping={"product_id": "product_id"})

# loading categories hierarchy into the cube
categories_tree_ds = session.read_csv(
    "categories_hierarchy.csv",
    store_name="Categories Hierarchy",
    sep=";",
    keys=["Category_Lvl3"],
)
products_categories_ds.join(categories_tree_ds, mapping={"Category": "Category_Lvl3"})
To organize the levels into a hierarchy in Atoti the following code can be used:
cube.hierarchies["Catalog"] = [
cube.levels["Category_Lvl1"],
cube.levels["Category_Lvl2"],
cube.levels["Category"],
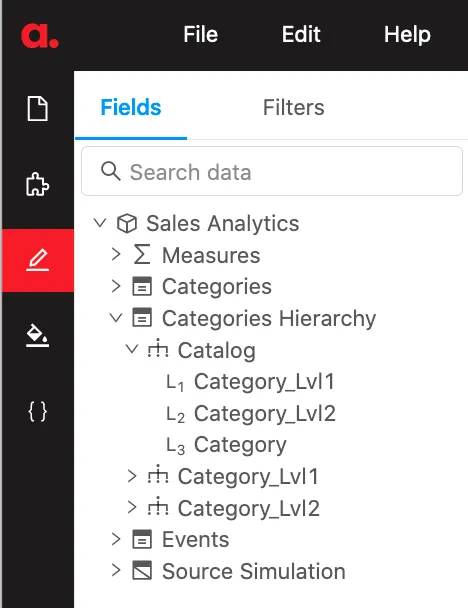
]After the above code is run, the new multi-level hierarchy “Catalog” can be selected from the content editor:
Now let me just quickly define a measure – computing unique sessions count (based on the data loaded in “Happy data scientist: How to build a business intelligence app with 10 lines of python code”) as follows:
cube.measures['UniqueSessionsCount'] = Atoti.agg.count_distinct(events_ds['externalsessionid'])Done, we can now visualize the measures and recompute the events count along the nodes of the hierarchy:
Instead of a conclusion
Thank you for reading this tutorial, I hope it’s helpful. Please let me know if you have any questions.