
Part 2: Fraud detection with Faker and PyCaret
This article is the second part of my credit card fraud detection series. I attempted to create a real-time credit card fraud detection application with the below three Python libraries.

I’ll be focusing a lot more on my experience with PyCaret, an AutoML library that will allow me to predict fraudulent transactions. Also, since I do not have the volume of transactions to train my models, I could only turn to synthetic data.
Check out my notebooks under Atoti notebook gallery for detailed implementations.
Faker
Financial institutions have a steady stream of transactions to help them train their artificial intelligence models. Despite that, there are some unique types of fraud that don’t have sufficient data for model training. Hence, we have companies generating fake fraud patterns to bolster the real training data, in an attempt to detect these anomalies.
In my case, my reason for using Faker is:
- I’m unhappy with the credit card fraud detection data I found on Kaggle. It’s heavily used everywhere as an example for fraud detection, but having the data anonymized, I can’t get a sense of its realism.
- I needed volume to train and test my machine-learning models, and to simulate real-time data streams.
Then, I discovered the Synthetic Credit Card Transaction Generator used in the Sparkov program. Brandon Harris did awesome work in generating fake credit card transaction data that includes labeled fraudulent transactions. Also, he’s very generous in sharing his code.
Consumer profiles
Underlying, the program uses Faker to generate customer details and merchants locations. A variety of profiles are used to create variation in the below features:
- Fraudulent / Non-fraudulent
- Male / Female
- Age groups ranging from less than 25, between 25 and 50, and older than 50
- Geographical location (urban/rural)
- Average transaction a day
- Weighted spending habits across time and period
- Weighted spending across various expenditure categories
I did slight modifications such that for a given period, the number of customers increased between 1 to 3 percent.
In comparison to the last Twitter experiment I did, I had little trouble getting my data. In that sense, I love synthetic data. On the other hand, it all depends on how good the algorithm used in generating the fraudulent data is, for it to be considered a usable dataset.
Read more about how I scraped Twitter for sentiment analysis. Also, check out my adaptation of the synthetic data generator.
AutoML experience with PyCaret
Tl;dr: I loved it!
I’ve enjoyed the experience with PyCaret because I didn’t have to bother too much about the details and I got my trained model much more quicker.
Compared to the weeks I spent on time series analysis on Twitter to forecast cryptocurrency returns and slightly less time on predicting churns, I had working models within a day. The time taken has to factor in the fact that I was playing with different features and also needed time running the prediction.
Classification vs Anomaly detection
PyCaret offers different modules that encapsulate different machine-learning algorithms. In this article, we will look at the two commonly used modules for credit card fraud detection-Classification and Anomaly detection.
Anomaly detection
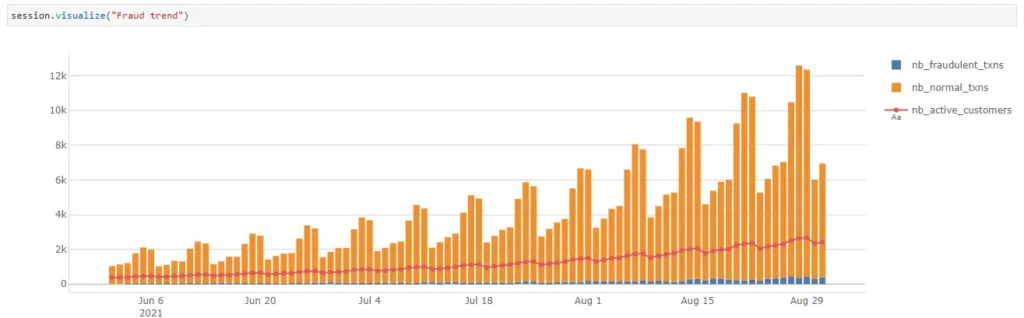
We have an imbalanced dataset, which means that there are more normal transactions than fraudulent transactions. In such cases, we can try to use an unsupervised learning method like anomaly detection.
PyCaret’s offers an Anomaly Detection Module that can be used for identifying rare items, events or observations which raise suspicions by differing significantly from the majority of the data. This module provides several pre-processing features that prepare the data for modeling through the setup function.
Here it is worth noting that, although we have the labels for the fraudulent cases, this module will not take those into consideration, being an unsupervised learning method.
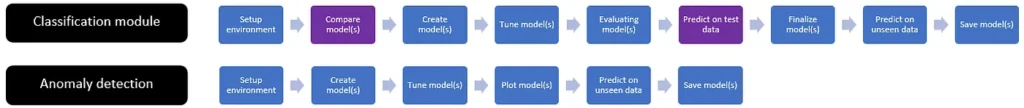
Compared to the classification module, the anomaly detection module is straightforward. We set up the environment and proceed to create the model we wanted.
from pycaret.anomaly import *

exp_ano101 = setup(
    data,
    normalize=True,
    ignore_features=["is_fraud"],
    numeric_features=["txn_during_night", "trans_weekend"],
    categorical_features=["zip", "merchant_id"],
    high_cardinality_features=["street", "city", "state", "zip", "merchant_id"],
    session_id=123,
)
There are many models available for anomaly detection. This is where I wish I could compare models as in the case of the classification modules (we will see later on). In the end, I chose the Isolation Forest model like the many examples I’ve seen online.
iforest = create_model("iforest")
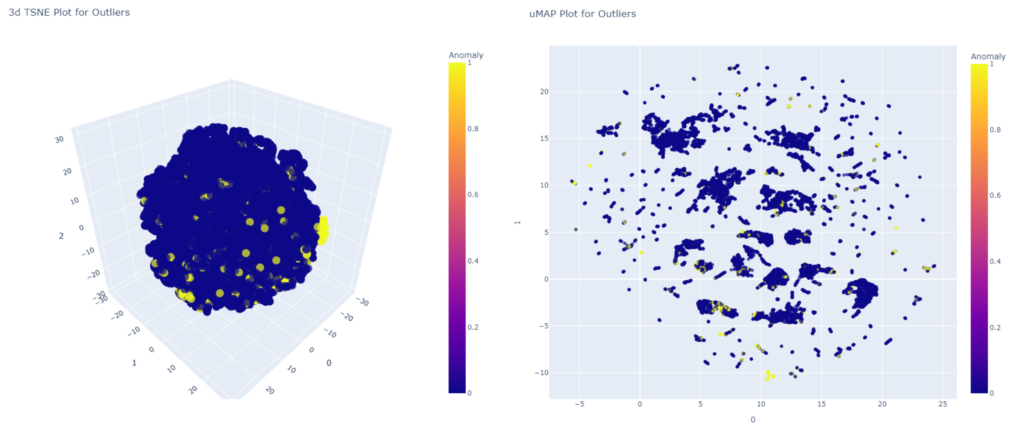
iforest_results = assign_model(iforest)We can plot the created model:
plot_model(iforest)To be frank, I find it hard to interpret the plots below, other than knowing how much of the dataset is classified as anomalous.
So what’s next?
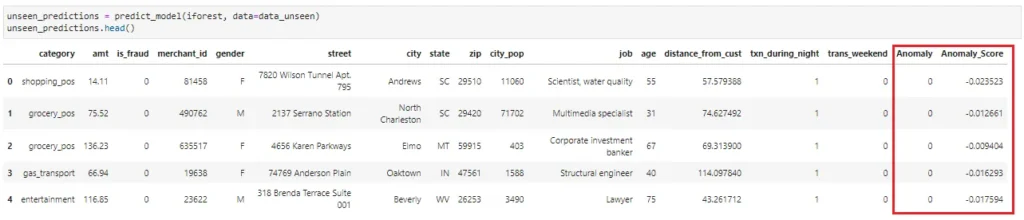
Let’s run the predict_model on the unseen data! The function outputs two columns:
- Anomaly (1 = outlier, 0 = inlier)
- Anomaly_Score (Outliers have larger score ~ I take it as the probability of it being an outlier)
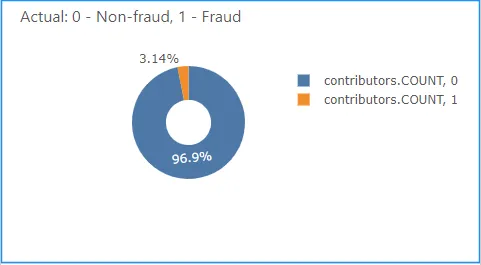
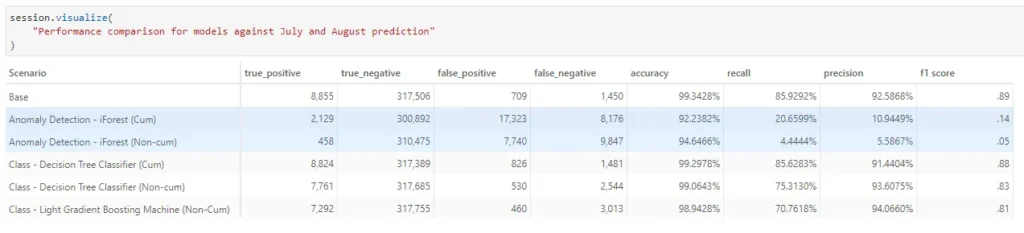
Unlike the classification module, we are unable to use the library’s API to check the accuracy of the unsupervised learning model that we have created. Below gives a quick view of how the model performed and the true positive rate is not very high.
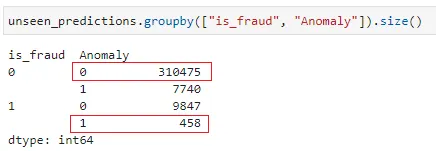
We will compare the accuracy of the anomaly detection against the classification module later in the article. Let’s take a look at the classification module.
Classification Module
If we were to google “PyCaret Credit Card Fraud Detection”, most returned examples used supervised learning, the Classification module of PyCaret instead.
Although PyCaret offers a way to fix the imbalance dataset, most examples just used the default setup and so I also followed the suit. I find the classification module more intuitive and interesting for someone new to machine learning because of:
1 – The ability to compare models
The compare_models function lists out the performance of each supported model. For someone who doesn’t know which model to use, this provides a direction on the potential models to use.
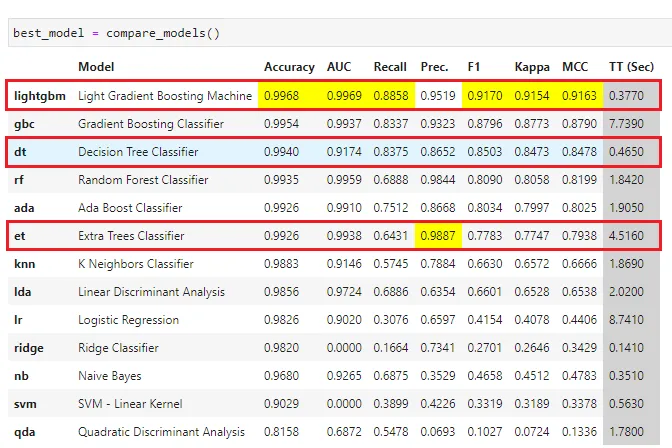
In my case, the F1 score and recall are more important. Hence I chose to create the models for the Light Gradient Boosting Machine which seems to be the best performing model, the Decision Tree Classifier with the next highest Recall value and lastly, Extra Trees Classifier which has the highest Precision value.
We shall compare and see their performance later on.
2 – Performance checking
We can see how the models perform from the initial creation, after the tuning of the hyperparameters to the actual prediction on training data.
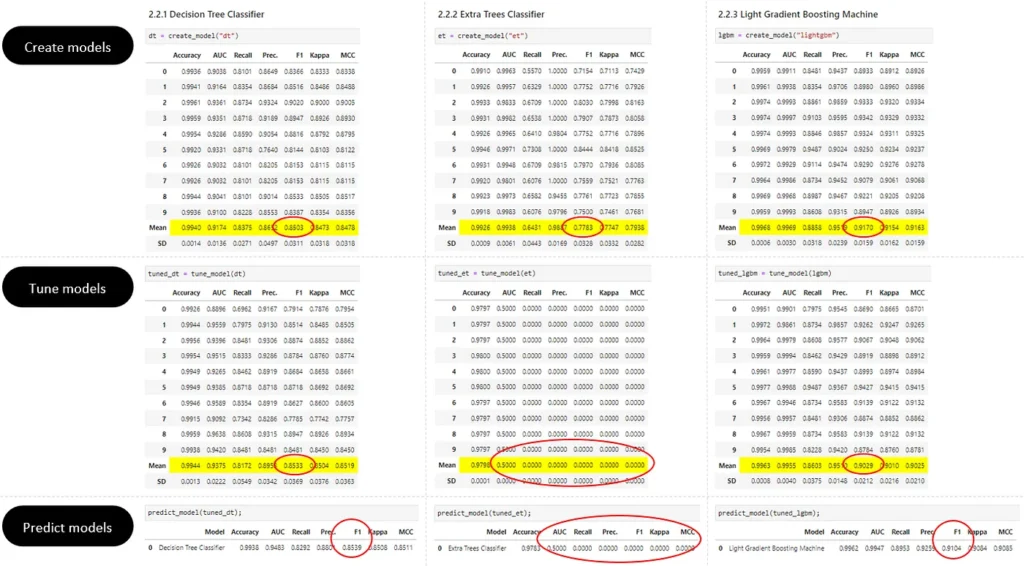
From the above comparison, we can safely drop the Extra Trees Classifier model from our evaluation since its F1 score literally becomes zero after the model tuning. The other two models remain pretty consistent, so there shouldn’t be any over-fitting.
Do note that we have the option to tune specific metrics but we used the default settings in our use case.
Ability to exclude features
After I completed my first round of implementation, I started to wonder if certain features matter at all. I decided to iterate my notebook with fewer features and luckily, PyCaret has this ignore_features parameter that allows me to do so easily.
from pycaret.classification import *

clf1 = setup(
    data=data,
    target="is_fraud",
    numeric_features=["txn_during_night", "trans_weekend"],
    categorical_features=["zip", "merchant_id"],
    high_cardinality_features=["street", "city", "state", "zip", "merchant_id"],
    ignore_features=[
        "nb_txns_1_days",
        "avg_txns_amt_1_days",
        "nb_txns_7_days",
        "avg_txns_amt_7_days",
        "nb_txns_30_days",
        "avg_txns_amt_30_days",
    ],
)
The features that are ignored are cumulative values for:
- the number of transactions in 1, 7 and 30 days,
- the average transaction amount in 1, 7 and 30 days.
I refer to them as cumulative features in this article.
Of course, I could also explore features such as remove_multicollinearity to remove the less correlated feature between two highly correlated ones. But I’m keeping the use case simple here.
Using Atoti to compare different model’s performance
With the different models, we have done predictions with unseen data and saved the results to CSV. We will make use of the Atoti cube created in the previous article to evaluate the performance of the various models against the business metrics created.
Read “Part 1: Investigating fraudulent transactions real-time with Atoti” to see how we make sense out of the prediction.
Loading each model into Atoti as a scenario
To do so, we will load the predictions into the Atoti table as scenarios, setting the model name as the scenario name:
prediction_tbl.scenarios["Class - Light Gradient Boosting Machine (Non-Cum)"].load_csv(
    f"{data_path}/july_aug_prediction_lgbm.csv"
)

prediction_tbl.scenarios["Class - Decision Tree Classifier (Cum)"].load_csv(
    f"{data_path}/july_aug_prediction_full_dt.csv"
)

prediction_tbl.scenarios["Class - Decision Tree Classifier (Non-cum)"].load_csv(
    f"{data_path}/july_aug_prediction_dt.csv"
)

prediction_tbl.scenarios["Anomaly Detection - iForest (Cum)"].load_csv(
    f"{data_path}/july_aug_anomalies_full_iforest.csv"
)
prediction_tbl.scenarios["Anomaly Detection - iForest (Non-cum)"].load_csv(
    f"{data_path}/july_aug_anomalies_iforest.csv"
)
Remember we have loaded the prediction from the LGBM into the cube, so it’s the base scenario. All other predictions are loaded as alternative scenarios.
Comparing models side-by-side in different visualizations
We can see that the base scenario which uses LGBM with the cumulative features predicted the most number of true fraud. Decision Tree Classifier works pretty well too. It seems that it is better to include the cumulative features in our model.
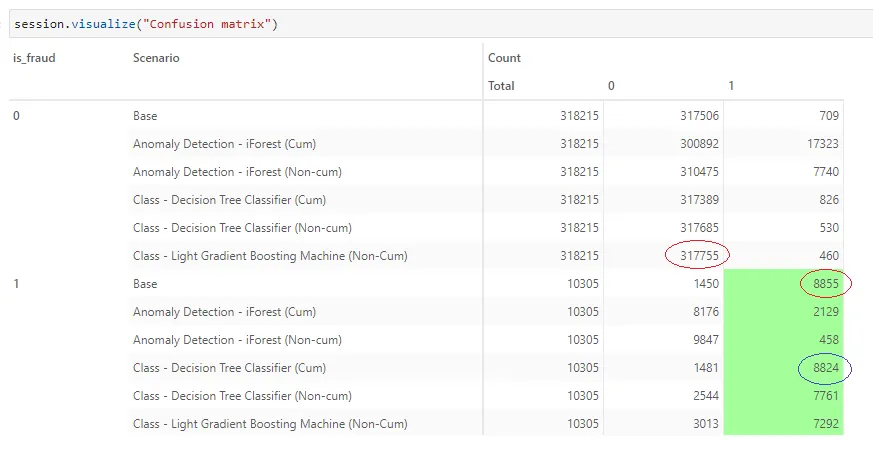
On the other hand, without the cumulative features, LGBM predicted the most number of non-fraud cases. So in either case, LGBM seems to be the best-performing model so far.
In general, the classification modules work better than the anomaly detection module.
Let’s translate these to the monetary value of the transactions.
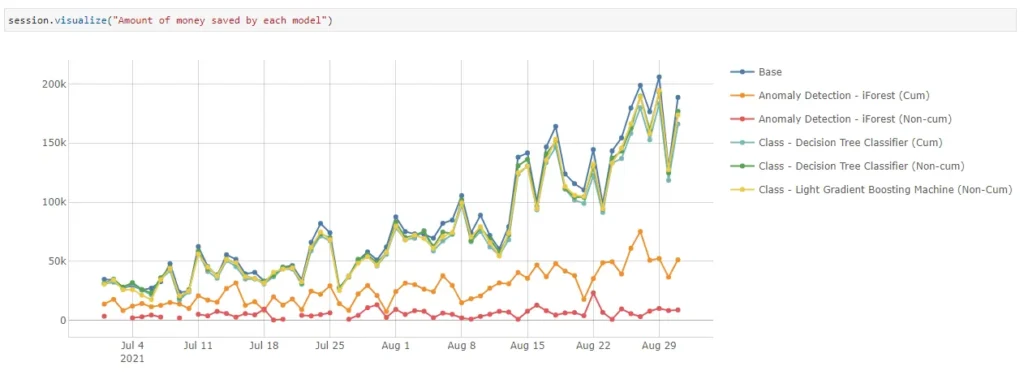
Based on the prediction by each model, we can alert consumers of potentially fraudulent transactions and prevent loss.
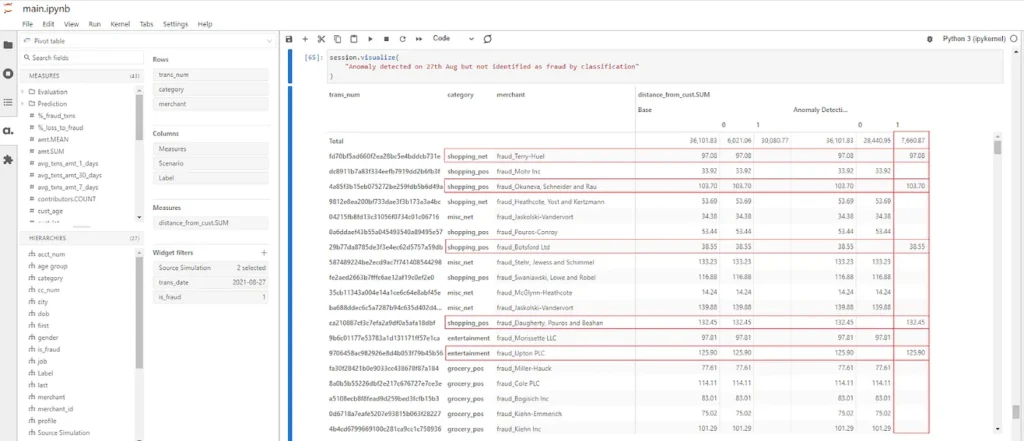
Zooming in on the fraudulent transactions on 27th Aug where there’s a spike in fraud detection by the anomaly detection, it might be interesting to investigate those that are not detected by the LGBM. It could be a new fraud trend that is not getting picked up by supervised learning.
While I won’t go further on this gap, you can always spin up the Atoti cube and perform the investigation yourself.
Environment setup in PyCaret
When we start diverging our dataset from the standard examples, we will get to see different behaviours. But the good thing is that we can easily find workarounds online for most issues.
The first and only mandatory step for PyCaret is the environment setup. In this step, PyCaret will perform:
- Inferring data type
- Cleaning and preparation of data
- Sampling data
- Train test split
- Assigning Session ID as seed
The amount of time taken to set up the environment depends on the amount of data and the number of cardinalities the features have. Using Kaggle’s credit card dataset, I went through setup in a breeze, using 7.67s for it to be completed.
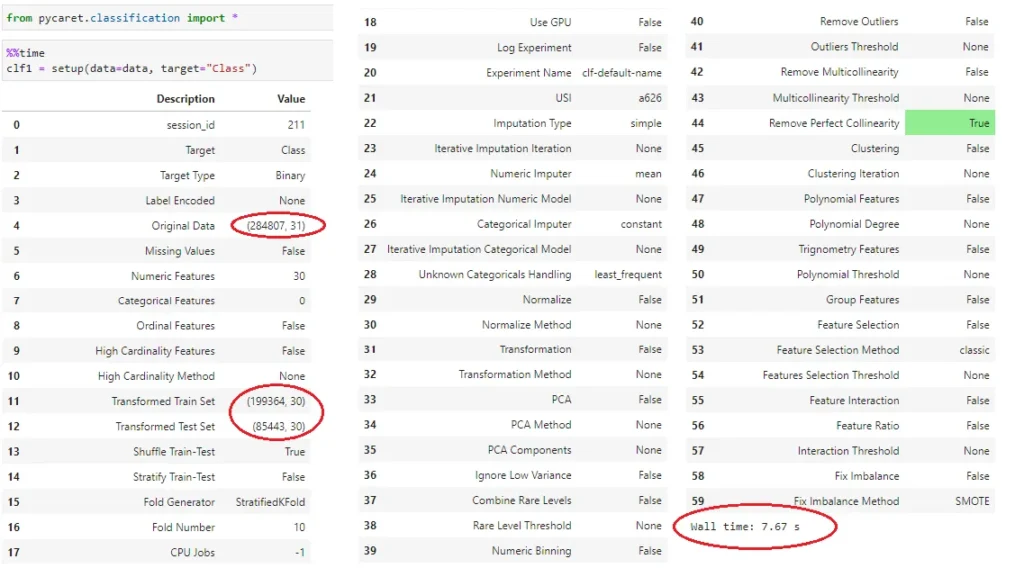
We can see the data set of 284,807 records is split into a training and testing set with a 70:30 ratio.
However, using the synthetic data, I started running into memory problems. With reference to the classification tutorial from PyCaret, I configured my setup as follows:
from pycaret.classification import *

clf1 = setup(
    data=data,
    target="is_fraud",
    numeric_features=["txn_during_night", "trans_weekend"],
    categorical_features=["zip", "merchant_id"],
)
I corrected some of the inferred data types using the numeric_features and categorical_features. With data shape (55648, 21), it went out of memory after more than half an hour.

Overcoming memory issue due to high cardinality
A quick googling online shows that I can overcome this issue using cardinal encoding. PyCaret can handle features with high cardinality using high_cardinality_features.
from pycaret.classification import *

clf1 = setup(
    data=data,
    target="is_fraud",
    numeric_features=["txn_during_night", "trans_weekend"],
    categorical_features=["zip", "merchant_id"],
    high_cardinality_features=["street", "city", "state", "zip", "merchant_id"],
)
I had also played around with the Principal Component Analysis (PCA) feature of PyCaret but I either ran out of memory or my features got reduced drastically when I set the pca_components between 0.95 to 0.99.
In Conclusion…
Usually, we spend a lot of time getting data and preprocessing them. In my use case, synthetic data offers a quick and handy way of getting modelled data for testing out the machine learning algorithms.
What I have not done in this use case is create a machine learning model from scratch and compare its performance against the performance of a model from AutoML. But in any case, PyCaret has saved me a lot of time in the machine learning aspect and I was able to integrate it with Atoti to have a real-time monitoring system.
I hope you have as much fun exploring these libraries as I have in building this use case.