Interactive decomposition with Atoti
This article is a part of a series. Check also: Part 1: Pro-rata allocation for a generic example of allocation into additive components and Part 2: Marginal contribution for an incremental analysis example. In this post, we’ll explore a technique which is handy for historical VaR decomposition – the “LEstimated VaR”, aka “Component VaR”.
If you wish to read what non-additive measures are and why we may want to have them decomposed – please refer to the Pro-rata allocation post.
The name “LEstimated VaR” refers to the term “L-estimator” – a linear combination of order statistics – as we’ll be zooming in the tail scenario, that has been identified as the VaR scenario for the parent portfolio to break down the portfolio’s VaR into the sum of contributions by sub-portfolios.
Such contribution analysis calculations are very hard, if not impossible to do with common data aggregation tools but easy with Atoti using “parent” and “sibling” data relationships which allows you to navigate any hierarchy of data and implement your on-the-fly allocation rules.
Solution #3: LEstimated VaR
In finance, the firm-level risk measure needs to be attributed down to desks in an additive manner to identify top risk drivers and allocate costs. VaR measure is non-additive, or more specifically it is sub-additive:
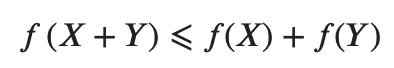
On the pivot table below you can see, that VaR computed at a portfolio level – Developed Markets – is smaller than the sum of sub-portfolio-level VaRs.

In this post, we create a measure – LEstimated VaR – which shows the simulated PL for the tail scenario, that has been identified as the VaR scenario for the parent Portfolio, hence allowing to break parent Portfolio’s VaR into additive risk contributions by sub-portfolios.
Python implementation
The algorithm for computing LEstimated VaR contributions is three-step:
- identify the VaR scenario of a portfolio,
- propagate this scenario down to the immediate children portfolios,
- lookup simulated PL for the scenario per scenario.
To identify the VaR scenario we’ll be using Atoti’s function n_lowest_indices:
# Compute the rank of the VaR scenario
vectorSize = Atoti.array.len(m["Position Vector"])
m["VaR Rank Current Portfolio"] = Atoti.math.floor((1 - m["Confidence Level"]) * vectorSize)

# Pick the id of the scenario at the rank
m['Tail Indices'] = Atoti.array.n_lowest_indices(m["Position Vector"], m["VaR Rank Current Portfolio"])
m['VaR Scenario Id'] = m['Tail Indices'][m["VaR Rank Current Portfolio"]-1]
m['VaR Value']= m["Position Vector"][m['VaR Scenario Id']]


# Create a measure to access the parent's level Id
m['VaR Scenario Id Parent'] = Atoti.parent_value(m['VaR Scenario Id'], {h["Trading Book Hierarchy"]: 1})
Having obtained the VaR scenario at the parent level, we’ll apply it to filter the historical PL vector and obtain the LEstimated VaR:
m['LEstimated VaR'] = m["Position Vector"][m['VaR Scenario Id Parent']]Since the historical PL scenario behind the LEstimated VaR for the sub-portfolios the same as the scenario used by a portfolio’s VaR, the contributions add up exactly to the VaR value:

If a hierarchy has multiple levels – for example, as in a banks’ organizational hierarchy – the allocation of the top-level values can apply every time the user expands it.
Conclusion
In this post, we discussed how to use parent and sibling relationships in Atoti to implement contributory measures and explained non-additive measures. I hope the described techniques can help solve your analytical needs.