How often were you tasked to turn over a functional, self-service dashboard to the business management team? What tools would you use to do so? The next time you’re in such a situation, try Atoti—a free Python BI analytics platform.
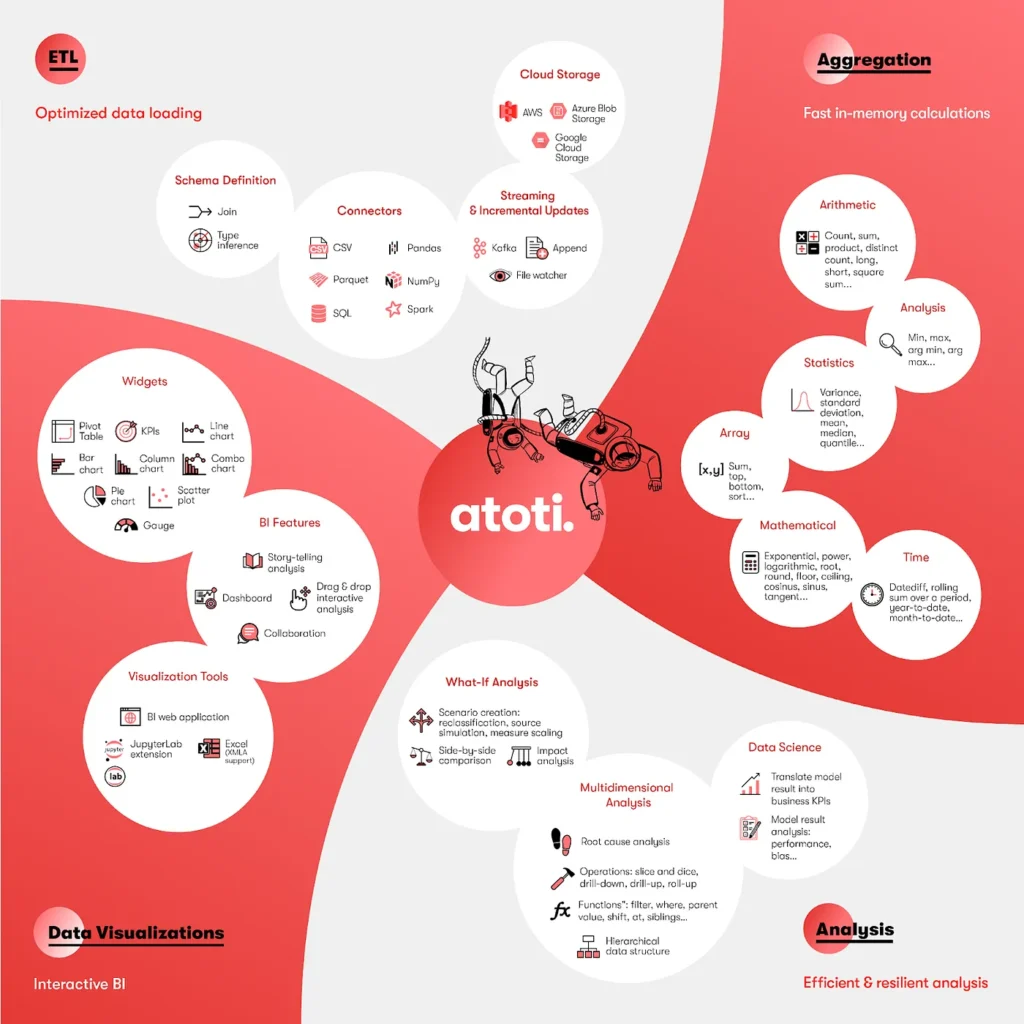
In case you’re wondering if it suits your needs, below are the features of Atoti:
In this article, we will focus on how we can work with the Atoti web application to create beautiful dashboards with storytelling capability. Before that, take a look at the complementary article on The How-tos of Atoti Dashboards.
Let’s use the instance from the wine analytics notebook from the Atoti notebook gallery.
Accessing the BI web application
Upon creating an Atoti session, an instance of the BI web application is created on a random port. However, it makes sense to access the web application only after the cube is created since we will need to access data from it.
💡Tip: It’s a good idea to fix the port for your session if you will be sharing dashboards with others. You can do so by setting the configuration during the instantiation of the
Sessionas follows:
session = tt.Session(port=9090)
The web application will be available via the port on the host where the script or Jupyter notebook is running Atoti on, e.g. https://<jupyter server hostname>:9090 as per the configured port above.
Alternatively, just run the command session.link() to access the URL to the web application:
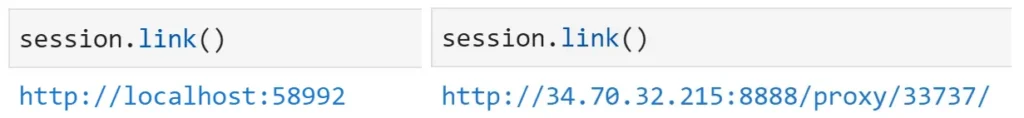
Click on the URL to open the web application on a browser tab.
Accessing dashboards
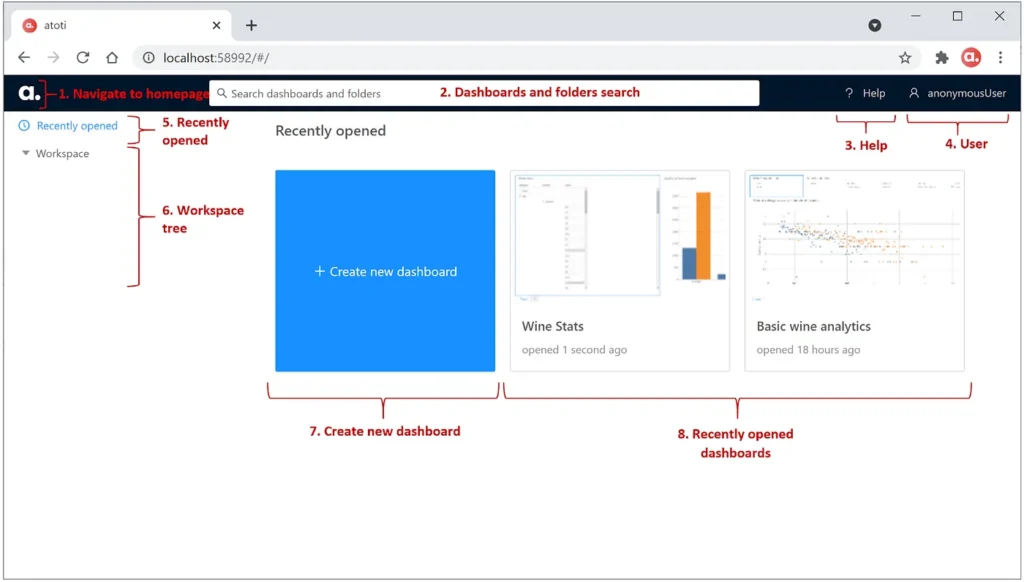
The below screen shows the default landing page for the web application. Most of the components are intuitive, hence we will not go into details of it. If you need more information, you can access the UI documentation.
There are many ways we can quickly navigate to the dashboard that we want:
1. Recently opened
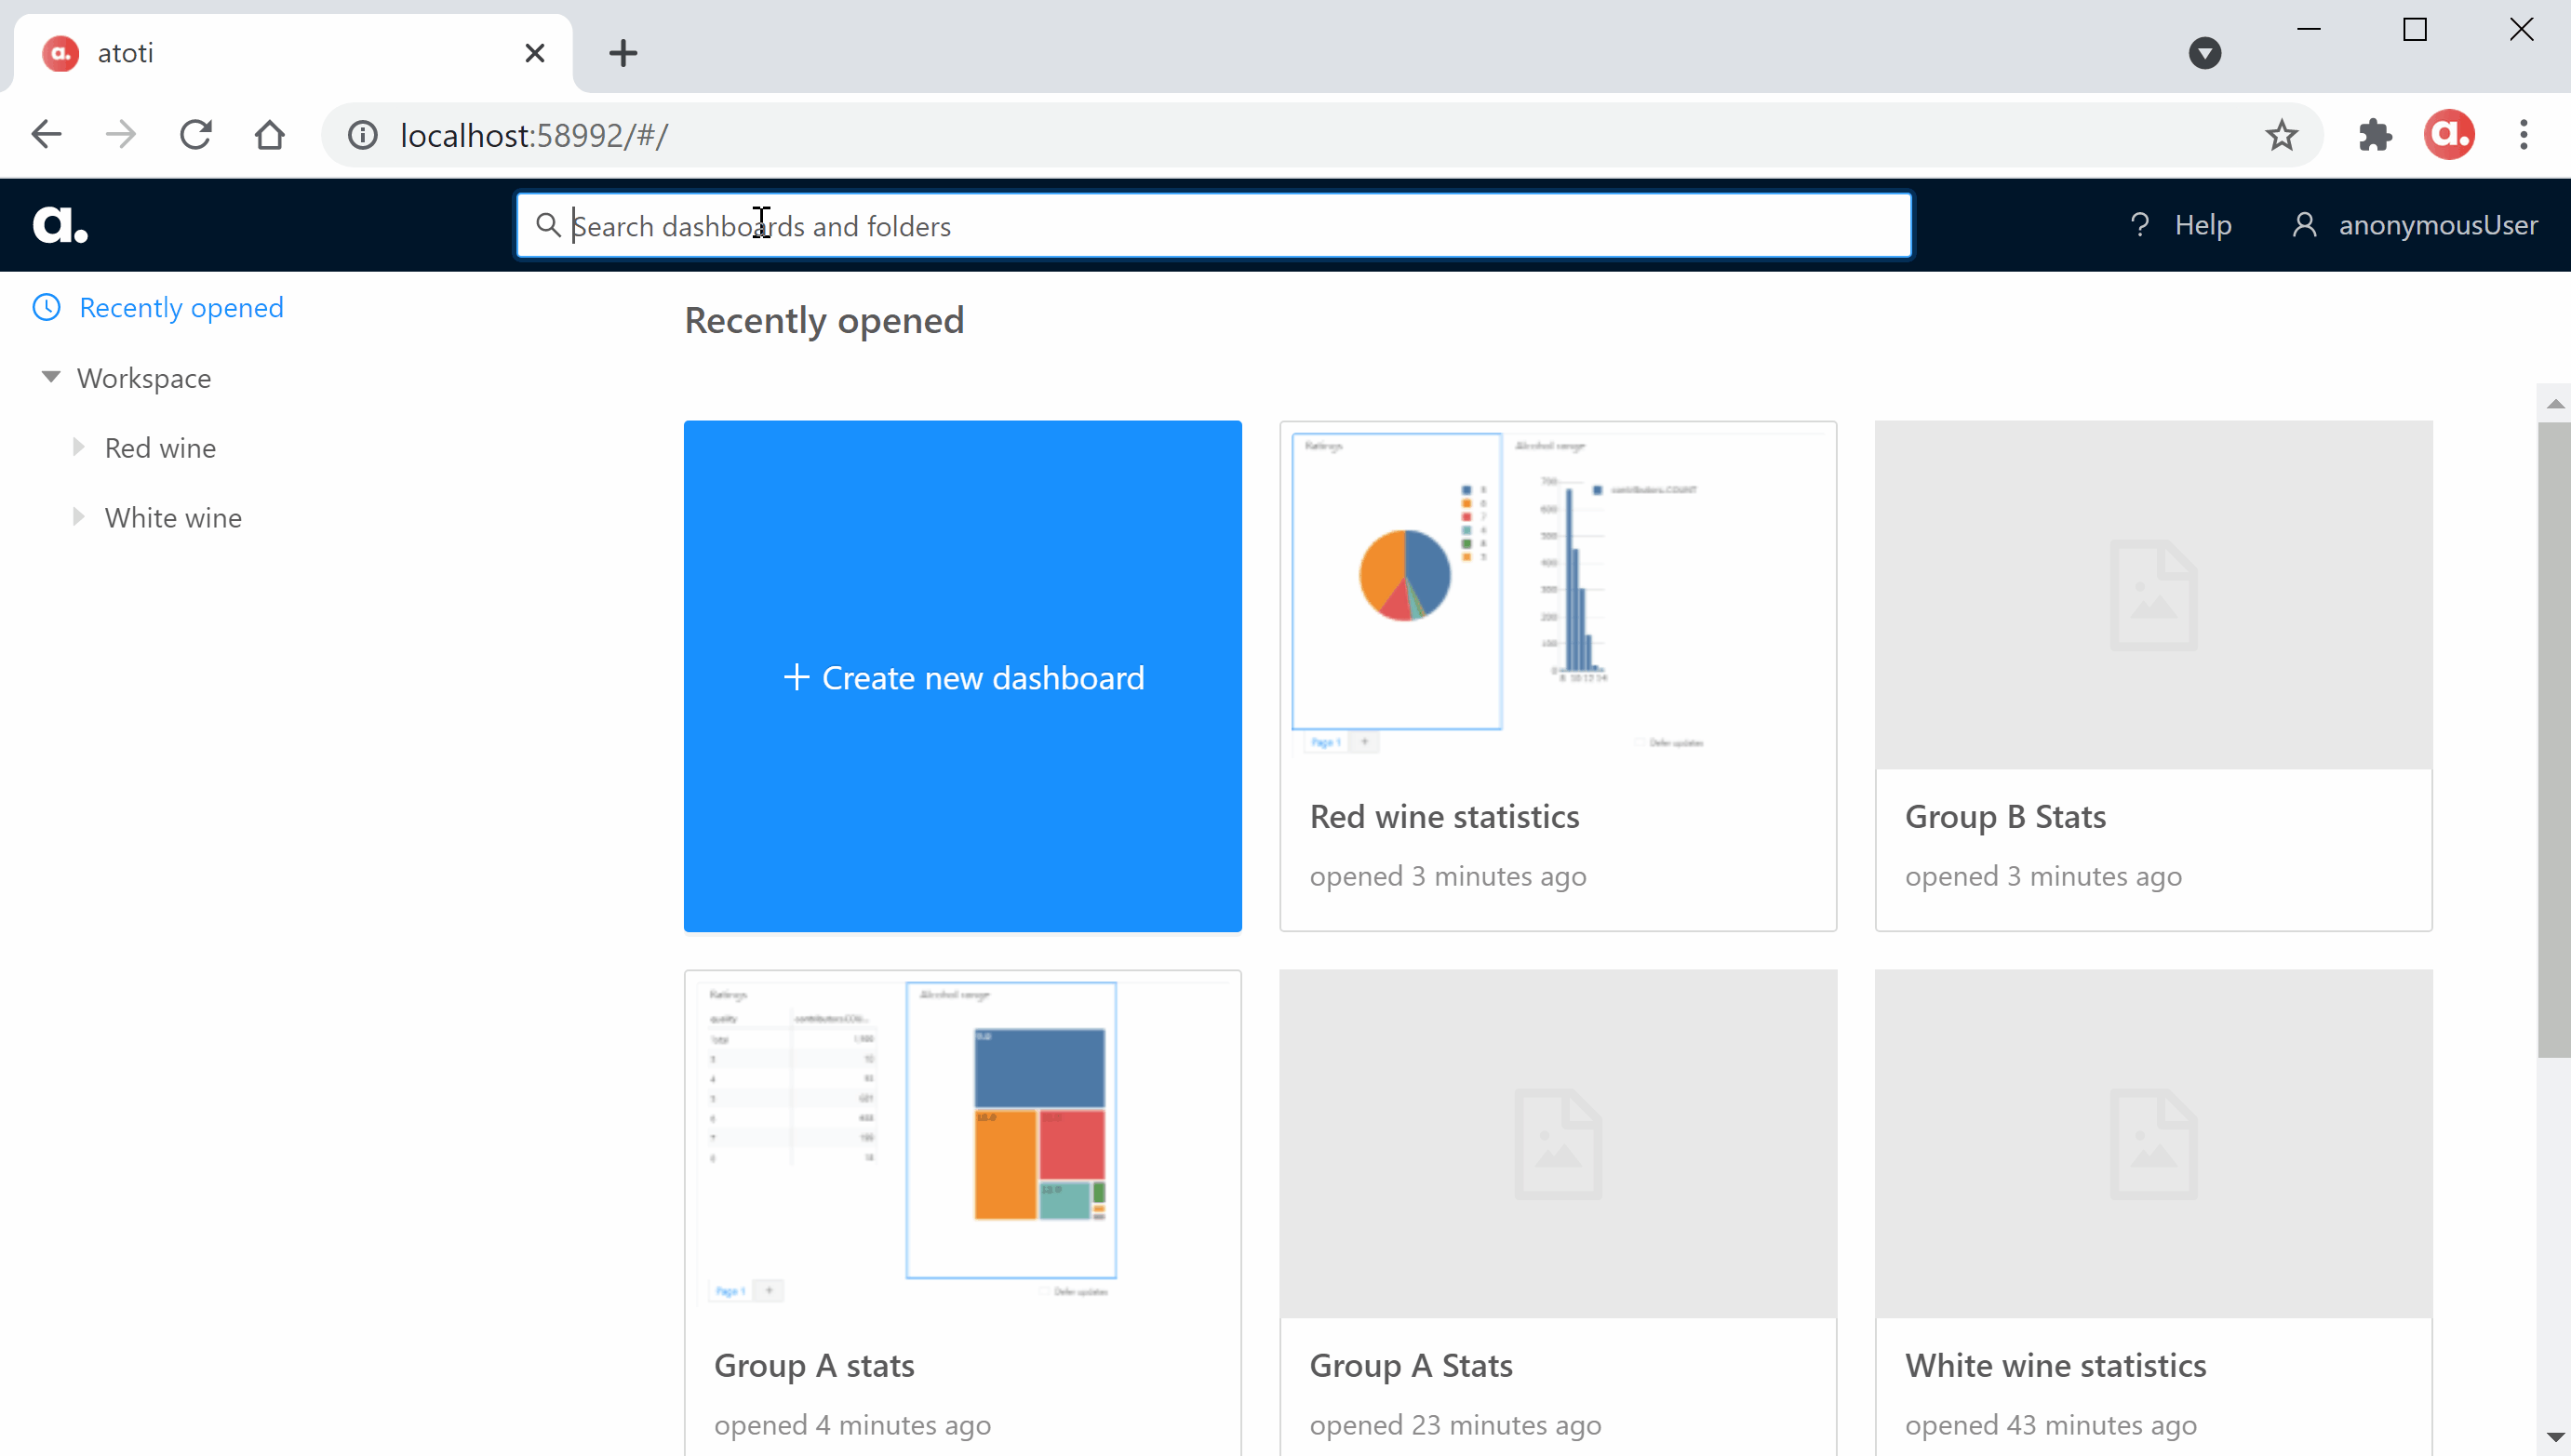
By default, the homepage displays the recently opened dashboards in the workspace area. This makes it easy to access the dashboard that we last worked on.
To launch the dashboard, simply click on the dashboard tile:
💡 Tip: To return to the landing page, simply click on the Atoti icon:
2. Dashboards and folder search
We can enter keywords from the dashboard’s title to perform a search and quickly launch the dashboard.
3. Workspace tree
We can create folders in the workspace to classify our dashboards.
By navigating the Workspace tree, we can access the dashboards under the respective folders.
4. Direct URL access
Each dashboard is identified the last 3 characters of its URL:
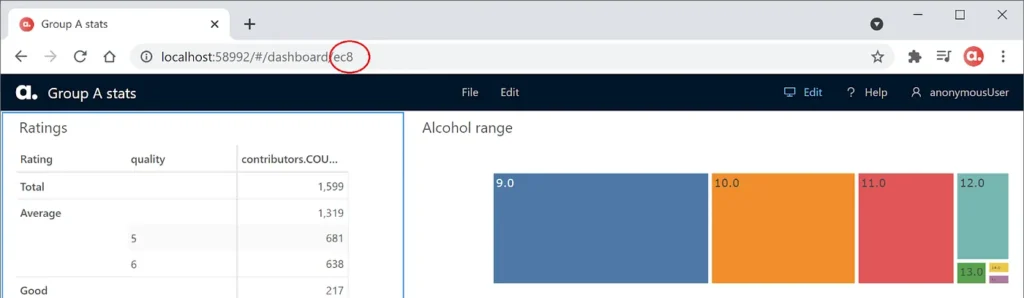
We can simply send the URL of the dashboard to people we want to share it with.
Creating a dashboard
We need to create a dashboard before we can access it. So how do we start creating one? Drop a note on Gitter if it’s not obvious from the screen below.
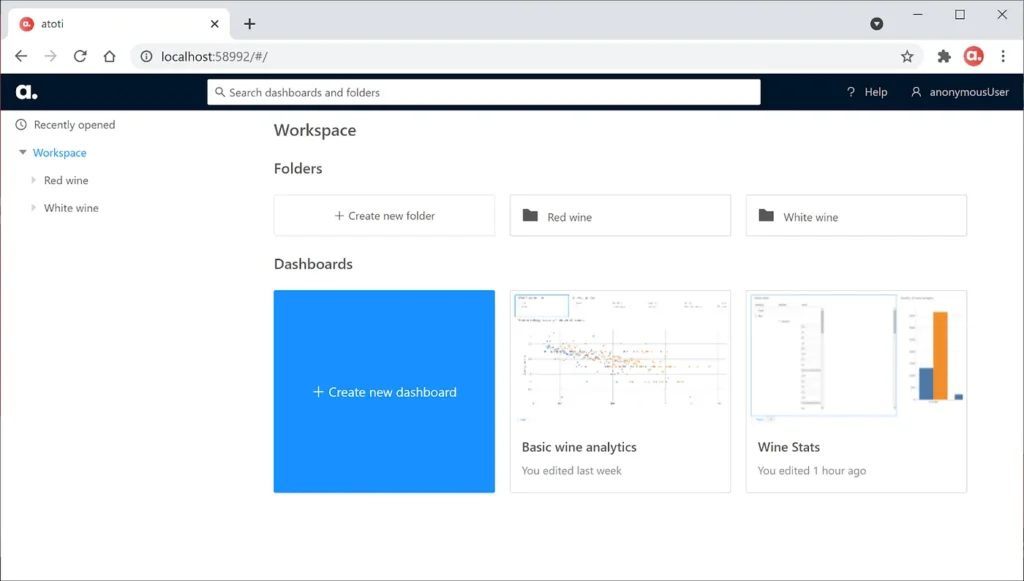
A blank dashboard will be launched in the workspace in edit mode. The key components are labelled in red below:
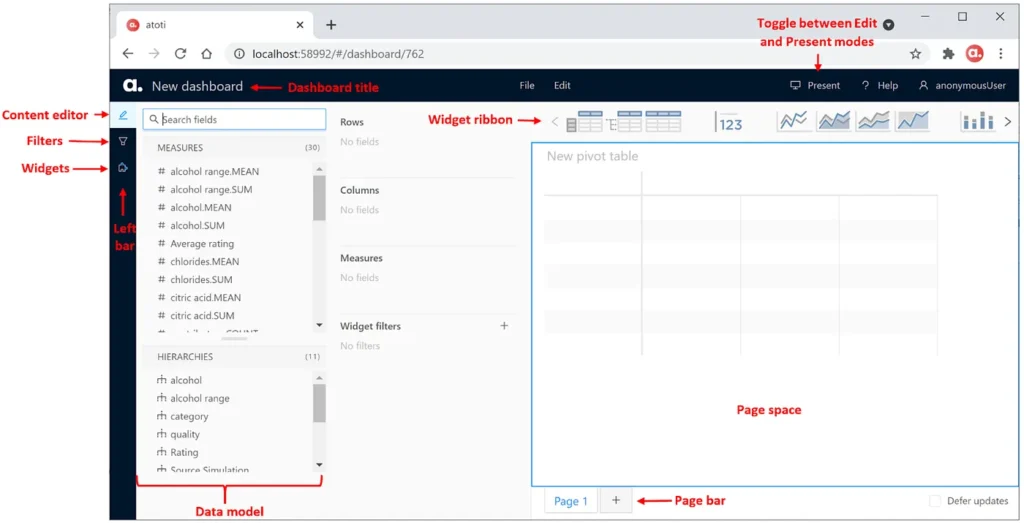
The dashboard starts with one page with a default pivot table that is empty. We can add pages to the dashboard via the page bar, and more widgets to each page via the Widget ribbon as we shall see later on.
Let’s start exploring the different components by populating the pivot table.
Working with a pivot table
To populate data into the pivot table, be sure that we are on the edit mode (i.e. the top right corner shows Present and we are able to see the left bar menu and the widget ribbon).
Content editor
Expand the Content editor drawer from the left bar to access the data model. The data model is split into 2 sections:
- Measures
- Hierarchies
We can adjust the size of the Content editor to access various sections while accommodating the screen space.
We can either click on a measure or hierarchy to add it to the pivot table. By default, a measure will be added to the Measure sections that fall under Columns while hierarchies will be added to Rows.
We can also drag them into Rows or Columns. Likewise, we can drag the tiles between the Rows and Columns.
We will come back to the Widget filters section again later on.
Working with widget ribbon
There are two ways we can work with the widget ribbon:
- Changing the visualization of an existing widget on the page
- Add widget tiles into the page
Changing visualization of an existing widget
In the previous section, we built a pivot table. We can easily switch it into different visualization by first selecting the Pivot table widget, then clicking on the target visualization type in the Widget ribbon:
Adding widgets tiles to page
Drag and drop the widget from the widget ribbon into the page when we want to place it. Alternatively, we can also drop it in place of an existing widget to replace it.
We can always resize the widgets by dragging their border or rearrange the widget tiles by dragging the title area around.
Zooming in on the widgets
Below are the types of widgets we have natively in Atoti.
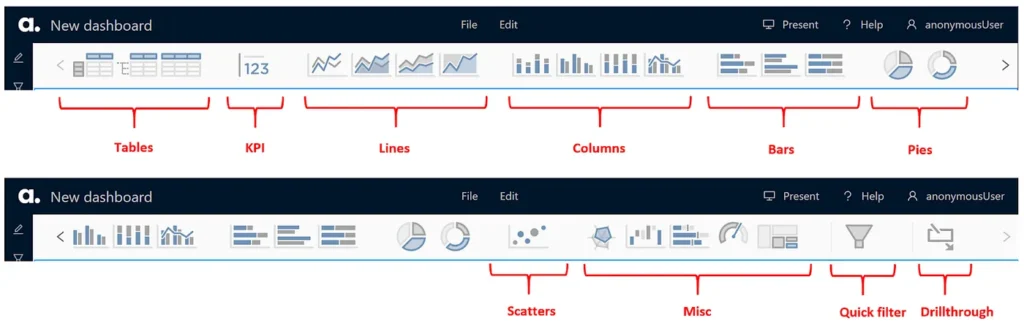
Note that some widgets such as Quick filter and Drillthrough are only available in the web application and not available from Jupyter notebook.
It is possible to extend the UI application via Atoti+ to add custom widgets.
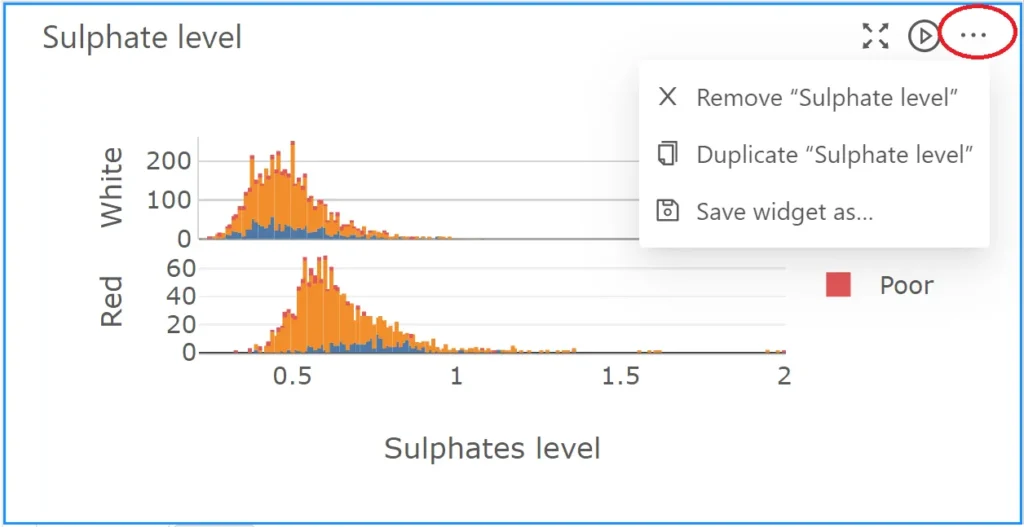
Working with saved widgets
Visualizations published from the Jupyter notebook can be accessed from the Widget drawer and added to the dashboards.
💡Tip: We can save commonly used widgets in dashboards via the ellipsis on the widget itself:
Storytelling with Atoti filtering functions
Quick filter
We saw the Quick filter widget earlier on. It is definitely an interesting widget that adds the storytelling element to our dashboard.
Each Quick filter widget allows us to select one hierarchy/level to filter the page by. It provides a user-friendly interface for users to interact with the dashboard, without having to access the content editor.
Filter on others
Other than the Quick filter, we can right-click on a value in the widget and select Filter on in order to zoom in on the analytics for that specific member. There are few options to filter on:
- Other widgets
- This widget
- All widgets
My personal preference is to filter on other widgets:
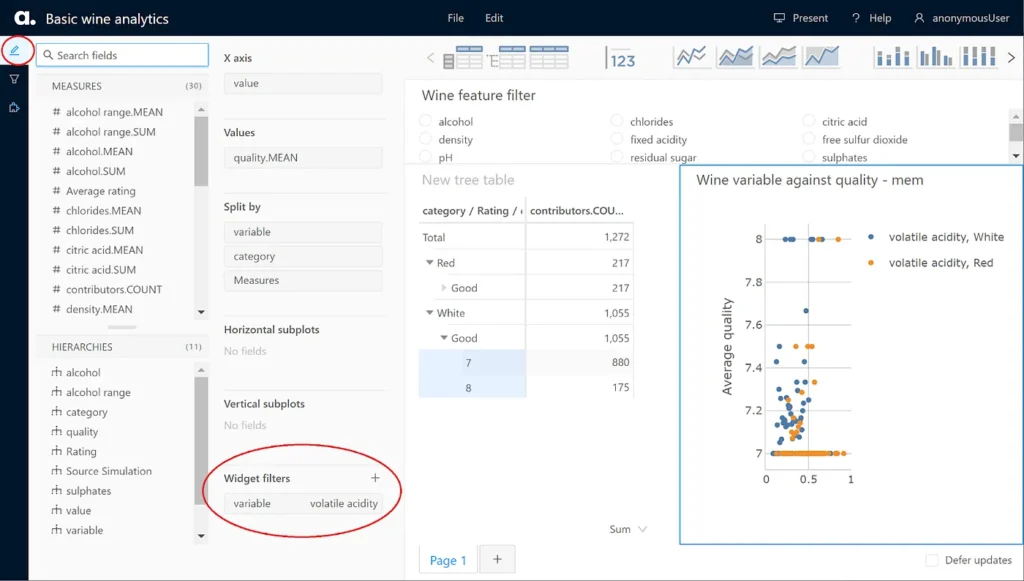
Understanding the filters
We saw from earlier examples that Quick filters add filters at the page level and Filter on add filters at the widget level. Let’s navigate to the Filters drawer on the left bar to understand the different types of filters we have in Atoti.
Default filters are applied on the cube level, normally created when we set slicing to True for a hierarchy. This means that the filter is applicable across all queries. We are unable to add filters on this level via the GUI.
While filters at the dashboard level apply across all widgets on all pages within the dashboard, filters at page level apply only for the selected page. Each page can have different filters. Similarly, each widget has its own set of filters.
To apply filters, simply drag the hierarchy into the specific level filter.
Another way to apply filters on a selected widget is via the content editor:
Refer to the UI documentation on how we can add advanced filters.
Deferring updates
A widget rerenders whenever a level, hierarchy, measure or filter is added to it. We can pause the rendering by selecting the Defer updates checkbox at the bottom right corner of the dashboard.
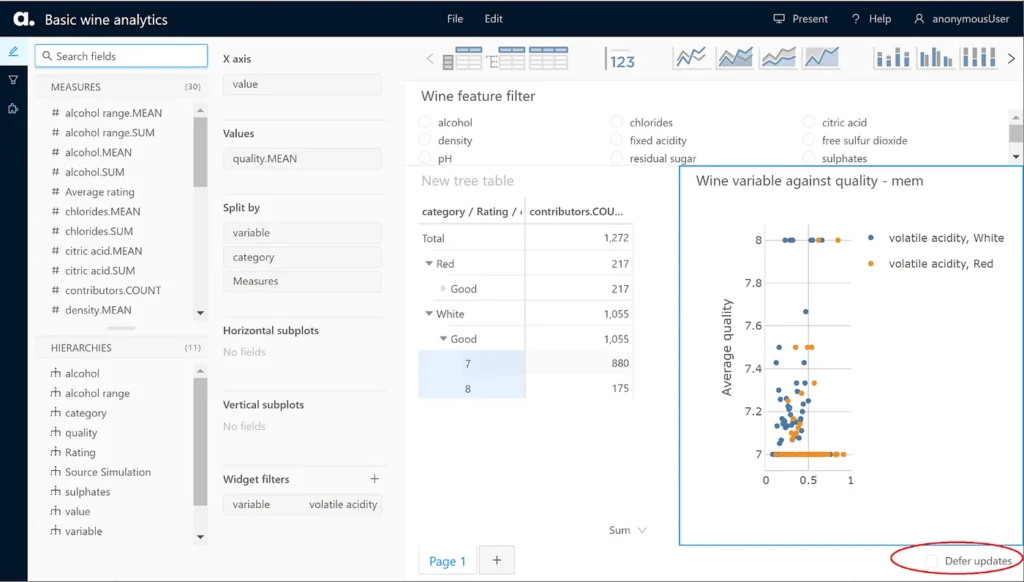
After we are done adding the necessaries to our widget, we can simply deselect the checkbox to trigger the rendering of the visualizations.
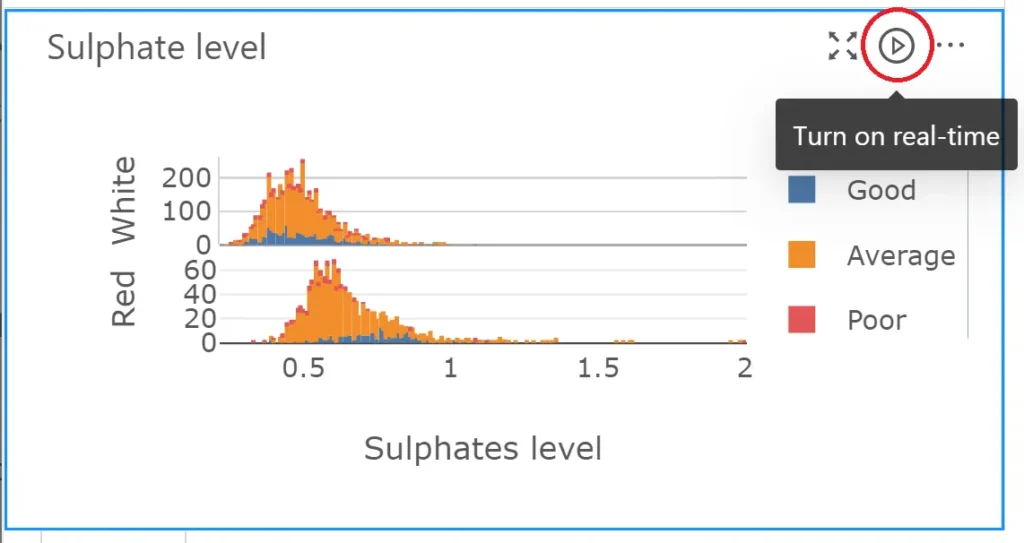
Showing real-time updates
Atoti supports incremental data loading and this means that there’s no need to restart the cube for subsequent data loads.
Sometimes, it is necessary for data to be reflected in our dashboard as they are loaded. To do this, simply click on the icon highlighted below to turn on real-time for the selected widget.
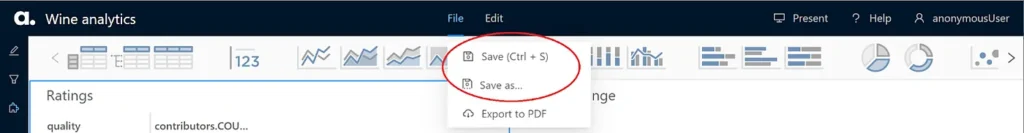
Saving dashboard
The final step to designing the dashboard is saving our hard work! Any one of the following will trigger a save:
1. Using shortcut key Ctrl+S / ⌘-S
2. Entering a name for the dashboard
3. Doing Save or Save As from the File menu.
💡Tip: Configured user_content_storage for persistence, otherwise the dashboard will only be available in the lifetime of the current session.
Presenting the dashboard
Voila! We have designed and saved our dashboard. For the big moment of presenting our work to those who matter, we don’t want to show the widget ribbon nor the left bar, do we?
Toggle to Present mode as shown below:
This guide is not exhaustive but these features should be intuitive enough for anyone who’s curious. Check out Atoti documentation on how to get started!